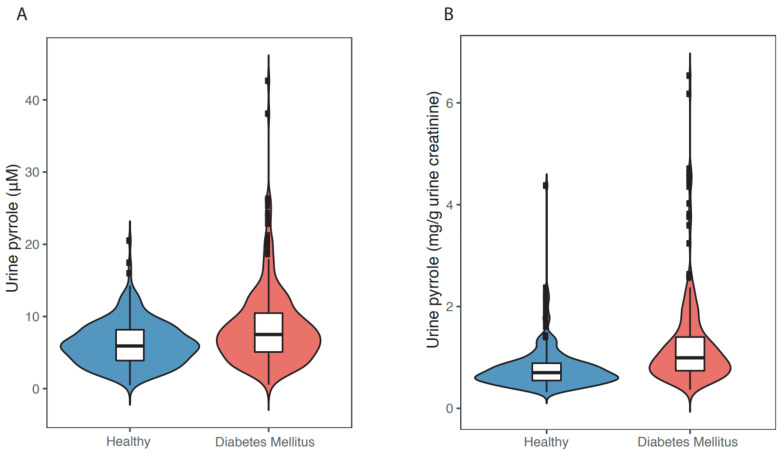
Figure 5.
Violin plots of the distribution of urinary γ-diketone pyrrole adducts before (A) and after (B) correction for urinary creatinine, the excreted metabolite of muscle creatine. The white box in the center represents the interquartile range and the center line in the middle represents the median value. The thin black line extended from the thick black bar represents the upper (max) and lower (min) adjacent values of the data. (Figure 5A was redrawn from [102]).

