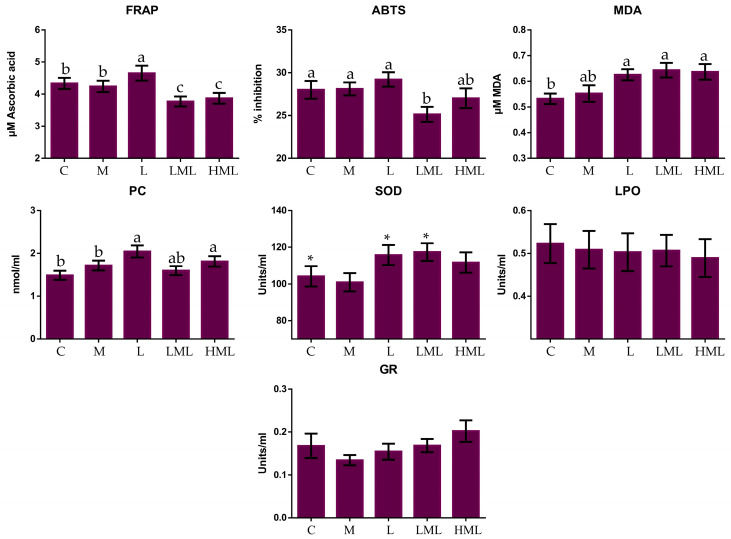
Figure 3.
Means ± SEM of total antioxidant capacity, oxidative stress indicators, and enzyme activities (Units/mL), in the milk of ewes, fed the five diets (C, M, L, LML, and HML) within the three sampling times. Bars with different superscript (a, b, c) between dietary treatments differ significantly (p ≤ 0.05), while * is referred to p-value < 0.10.

