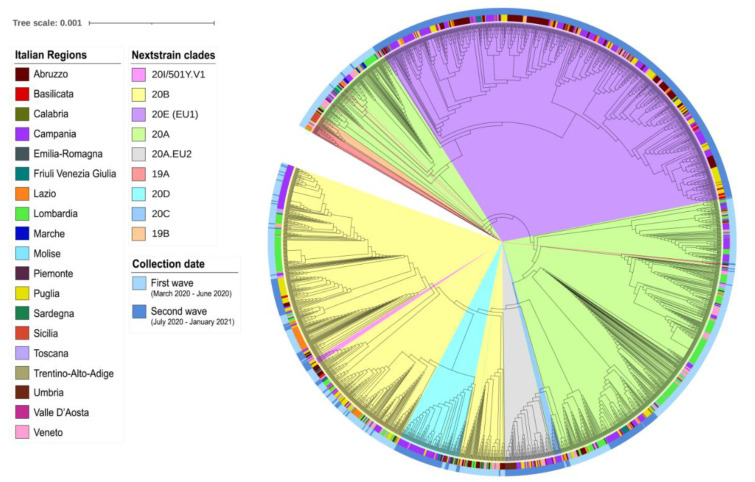
Figure 2.
Phylogenetic tree showing the relationship between the 2244 Italian SARS-Cov-2 genome sequences. The tree was inferred with the approximate maximum likelihood method as implemented by FastTree v2.1 [21] and decorated with iTOL. Nextstrain clades are highlighted in pastel colors. The Italian region of sample collection is shown across the inner colored strip, the outer circle displays the sampling date, sorted into first wave and second wave. A newick (plain text) version of the phylogenetic tree, with branch lengths and support values at nodes, is reported in Supplementary File 2.

