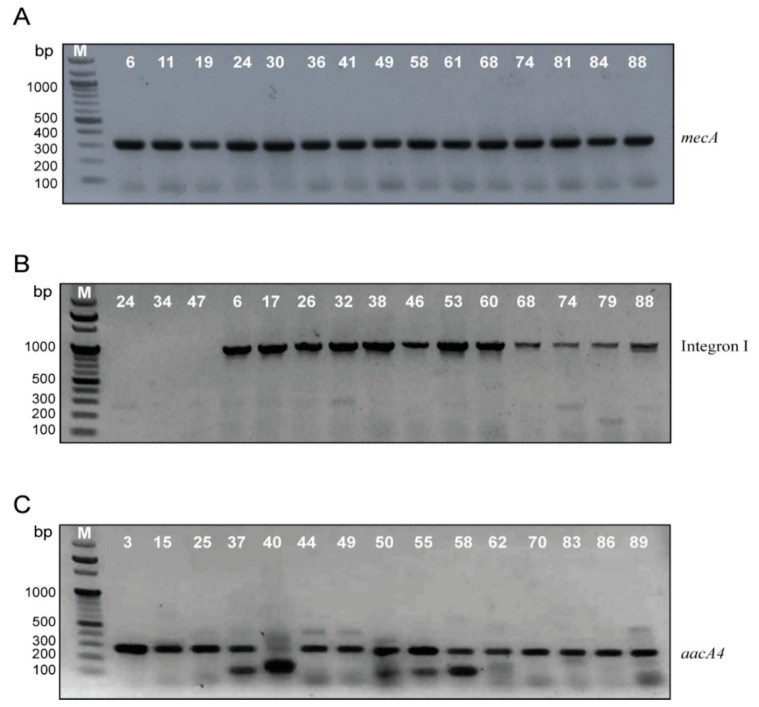
Figure 3.
Electrophoretic graph of PCR products on 1.5% agarose gel stained with ethidium bromide for (A) mecA gene among S. aureus isolates, positive isolates gave a single band of 310 bp. (B) Integron I amplicon among MRSA, positive isolates gave a single band of either 250 bp or 1000 bp. (C) aacA4 gene among MRSA, positive isolates gave a single band of 200 bp.

