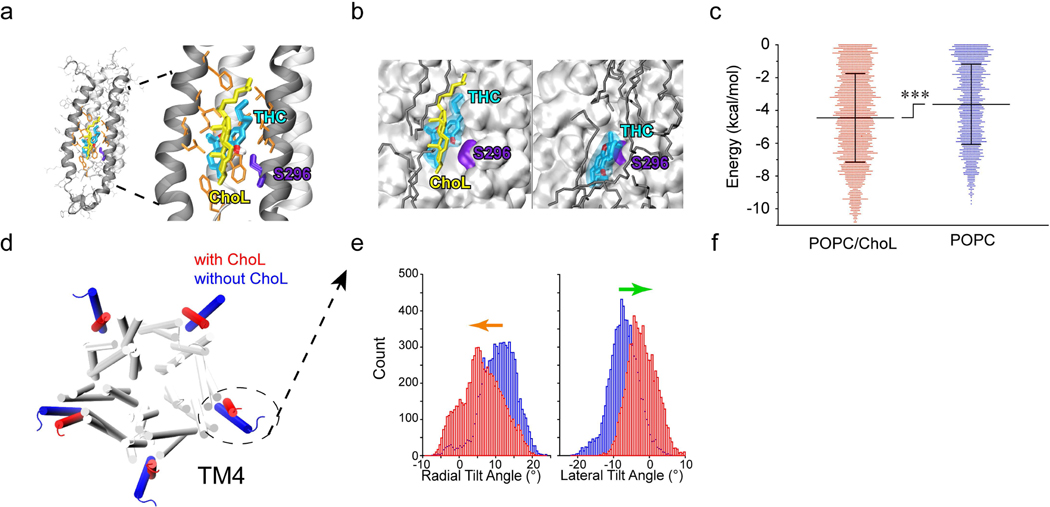
Figure 6. Cholesterol dependence of THC-GlyR interaction through both direct and indirect mechanisms.
(a) Side view of docking model of α1 GlyR (black ribbons) and THC binding pocket. S296 is highlighted in violet, THC is labeled in cyan and cholesterol (ChoL) is shown in yellow. (b) Representative conformations of THC bound to α1 GlyR in POPC/cholesterol (left) or POPC alone (right). THC binds α1 GlyR closer to S296 and with lower energy in the presence of cholesterol than with POPC (dark gray) alone. (c) Free binding energy required for S296-THC interaction in the presence or absence of cholesterol (n=3). Data are expressed as the mean ± SD. ***P<0.001 based on an unpaired t-test. (d) Cholesterol-induced conformational changes in α1 GlyR in POPC/ChoL and pure POPC. The fourth transmembrane helices (TM4s) are highlighted in the presence of cholesterol (red) and in the absence of cholesterol (blue). (e) Histograms of radial (left) and lateral (right) α1 GlyR TM4 tilt angles in POPC/ChoL (red) and pure POPC (blue). Cholesterol-induced conformational change in TM4. Arrows (radial, orange) and (lateral, green) angles indicate the tilt direction of TM4.

