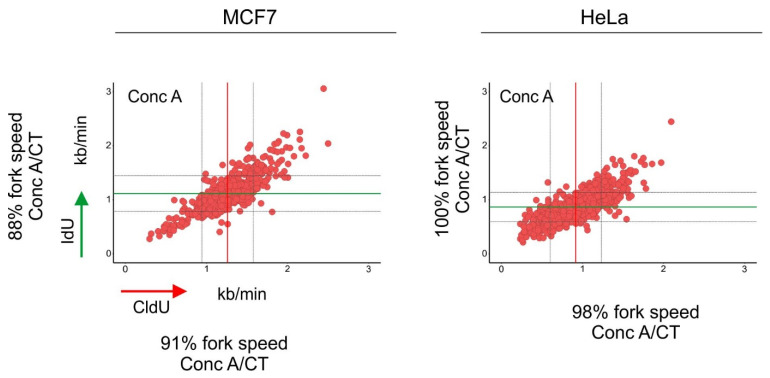
Figure 3.
Inhibition of autophagic flux reduced the speed of DNA replication fork progression. Cells were pulse-labeled with CldU (red) for 20 min, washed with the medium and pulse-labeled with IdU (green) for a subsequent 20 min. Cells were lysed and their DNA was stretched. Nucleosides were detected with antibodies, and the length of CldU and IdU pulses (µm) was converted into kb/min as in [39]. Before the labeling, cells were incubated for 1.5 h with concanamycin-A (Conc A; 2 nM). The length of every replication fork was converted into kb/min and is plotted on the graphs. Dataset for MCF7 cells was taken from [30]. Conc A-treated mean fork speed: CldU = 1.25 kb/min and IdU = 1.11 kb/min; number of scored forks: n = 615. HeLa cells, Conc A-treated mean fork speed: CldU = 0.91 kb/min and IdU = 0.86 kb/min; number of scored forks: n = 751. The red line indicates the mean fork speed of the CldU pulse, and the green line indicates the mean fork speed of the IdU pulse. Grey lines indicate SD. Indicated percentages of the fork speed were obtained by calculating the fork speed ratio control/concanamycin-A. Control values of the fork speed from untreated cells are shown in Figure 2. Concanamycin-A treatment reduced the speed of fork progression in MCF7 cells.

