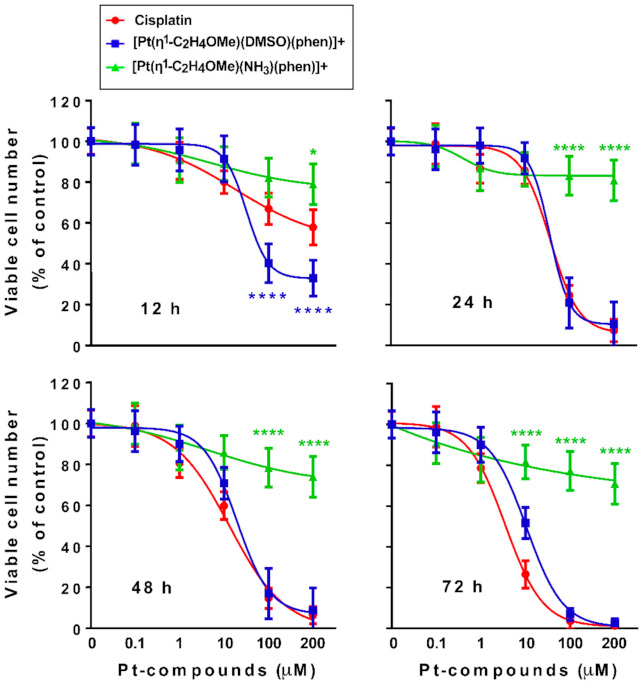
Figure 4.

Cell viability assay after [Pt(η1-C2H4OMe)(DMSO)(phen)]+, [Pt(η1-C2H4OMe)(NH3)(phen)]+, and cisplatin treatments in SH-SY5Y cell line. The viability of the neuroblastoma cell line was evaluated after treatment with Pt compounds at different concentrations (0.1, 1, 10, 100, and 200 μM) for 12, 24, 48, and 72 h. The data are means ± S.D. of three different experiments run in eight replicates and are presented as percent of control. Asterisks indicate values that are significantly different (* p < 0.05; **** p < 0.0001) from those of cisplatin at the same concentrations and time points.
