. 2021 Apr 30;10:e65615. doi: 10.7554/eLife.65615

Figure 2. Differences in the magnitude of the response to Trp2 immunization in wild-type (WT) and Dct-/- mice.

Mice were primed with TriVax (50 μg each of Trp2 and B8R peptides; A–E). The number (A) or percent (B) of splenic Trp2/Kb or B8R/Kb-specific cells was assessed at day 7. (C, D) The tetramer fluorescence intensity of splenic Trp2/Kb-specific cells was compared. (E) Gating for dual Trp2/Kb tetramer-positive CD8+ (samples were not enriched for Trp2/Kb-specific cells). (F) The frequency of the indicated splenic population expressing PD-1 is shown. Data in A and B are compiled from more than three experiments. Data in C–F are representative of three or more similar experiments. Squares indicate male animals. *p<0.05, ****p<0.0001 by unpaired t test (C) or one-way ANOVA with Sidak’s multiple comparisons test (A, B, F).

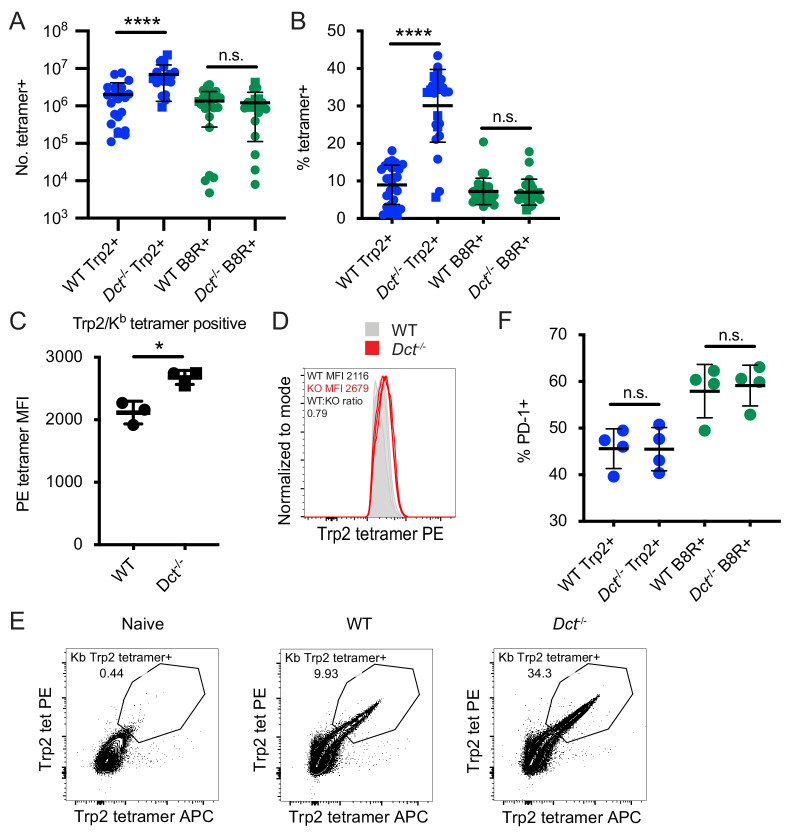
Figure 2—source data 1. Data file related to Figure 2.
elife-65615-fig2-data1.pzfx (317.4KB, pzfx)

Figure 2.

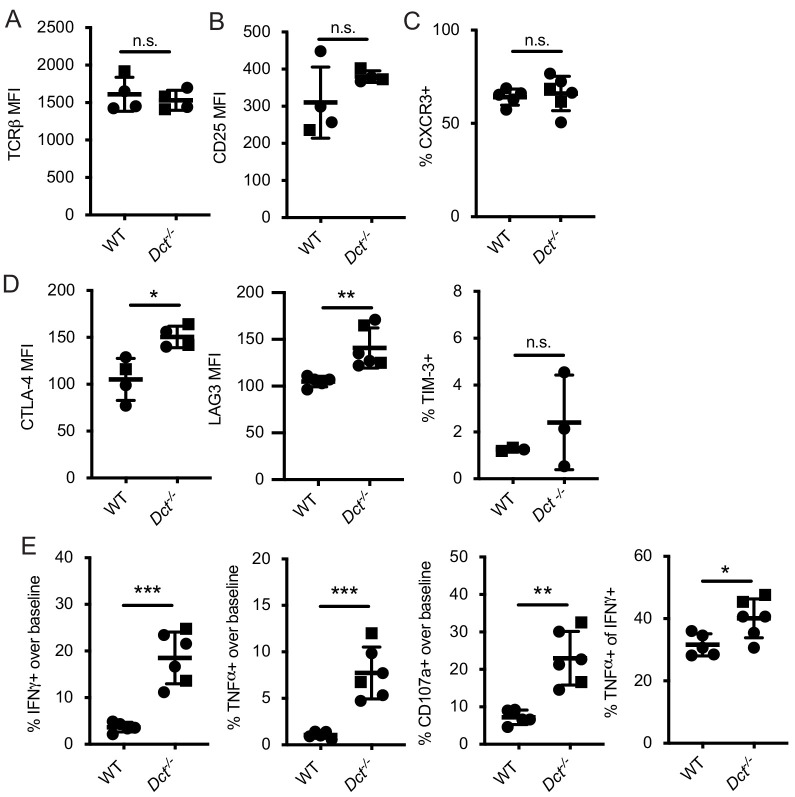
Figure 2—figure supplement 1. Additional phenotyping and functional analysis of Trp2/Kb-specific cells at day 7 after TriVax.

Figure 2—figure supplement 1.

The median fluorescence intensity of (A, B, D) or frequency of cells expressing (C, D) the indicated marker are shown for Trp2/Kb tetramer-positive cells from the spleens of mice treated with TriVax (intravenous or intraperitoneal administration) containing Trp2 peptide 7 days prior. (E) Splenocytes harvested at this time point were stimulated for 6 hr with Trp2 peptide and stained for cytokine production (intracellular stains) and CD107a expression (antibody added prior to stimulation). Squares indicate male animals. Data represent individual experiments with three to six mice per group. *p<0.05, **p<0.01, ***p<0.001 by unpaired t test.
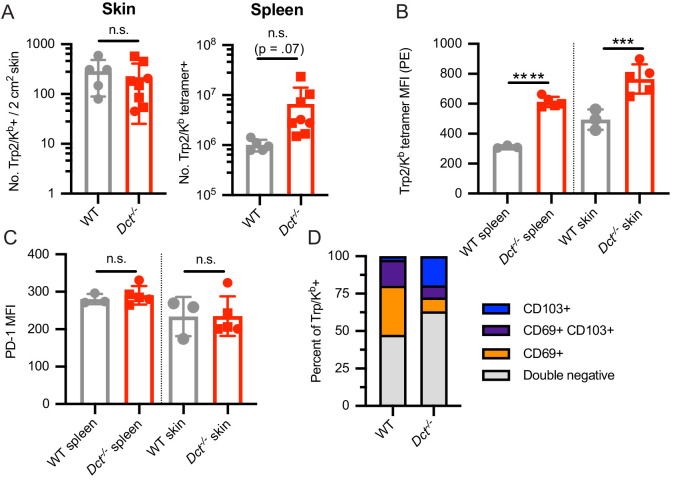
Figure 2—figure supplement 2. Analysis of Trp2/Kb-specific cells in the skin of wild-type (WT) and Dct-/- mice at day 7 after TriVax.

Figure 2—figure supplement 2.

Mice were treated with TriVax containing Trp2 and B8R peptides (100 μg each) and sacrificed at day 7. An ~2 cm2 piece of skin from the flank of each mouse was shaved, collected, and processed to a single-cell suspension; spleens were also collected. (A) The number of Trp2/Kb-specific cells in the piece of skin (left) or spleen (right) are shown. For Trp2/Kb tetramer-positive cells, the tetramer median fluorescence intensity (MFI) (B), PD-1 MFI (C), or frequency of cells expressing CD69/CD103 (D) are displayed. Squares indicate male animals. Data represent two compiled experiments (A) or individual experiments (B–D). ***p<0.001, ****p<0.0001 by unpaired t test. Welch’s t test was used to compare the number of splenic Trp2/Kb-specific cells in A (p=0.07).
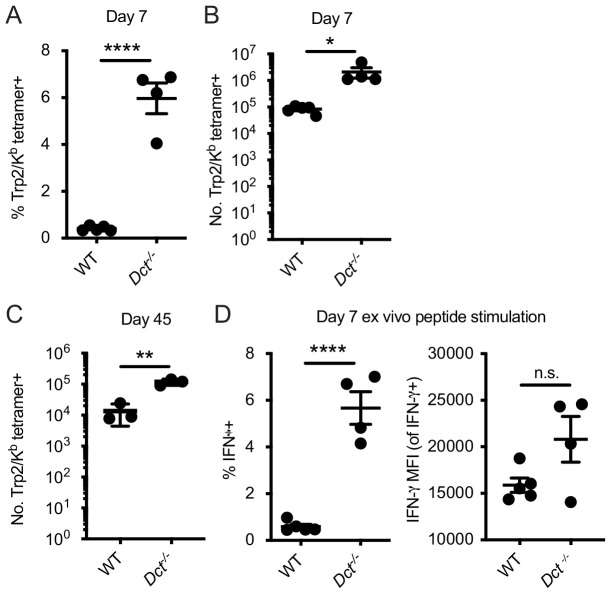
Figure 2—figure supplement 3. Response to infection with Listeria monocytogenes strain expressing Trp2 (LmTrp2).

Figure 2—figure supplement 3.

Mice were infected with a recombinant LmTrp2. The percent (A) or number (B, C) of splenic Trp2/Kb-specific cells was assessed at the indicated day. (D) Day 7 splenocytes were stimulated for 4–6 hr with Trp2 peptide and intracellular staining was performed to assess cytokine production. Data in A, B, and D are representative of three similar experiments; data in C represent individual experiments with two to five mice per group. Squares indicate male animals. *p<0.05, **p<0.01, ***p<0.001, ****p<0.0001 by unpaired t test.