. 2021 Apr 30;10:e65615. doi: 10.7554/eLife.65615

Figure 6. Wild-type (WT) Trp2/Kb-specific cells are unable to mediate efficient anti-melanocyte activity.

(A) WT mice were monitored for vitiligo after receiving 50,000 Trp2/Kb-specific cells from WT or Dct-/- donors primed with TriVax 7 days prior; recipient mice received TriVax (100 μg Trp2) on the day of transfer and were treated with dinitrofluorobenzene (DNFB) (left flank) 6 days later. No cell transfer controls (not shown in schematic) received TriVax and DNFB but no transferred cells. (B) Recipient mice were bled on day 6 after transfer and TriVax; the number of transferred Trp2/Kb-positive cells per μL blood is shown. (C) Kaplan-Meier curve of vitiligo development; mice were considered to have vitiligo when they first had a vitiligo score of two that was sustained. Mean group vitiligo scores over time are shown in (D), with a dotted line indicating definite vitiligo. Data in C and D are compiled from three experiments with 4–10 mice per group. Data in B are compiled from two experiments with 4–10 mice per group. ****p<0.0001 by unpaired t test (B), log-rank survival analysis (C), or two-way ANOVA followed by Tukey’s multiple comparisons test (D).

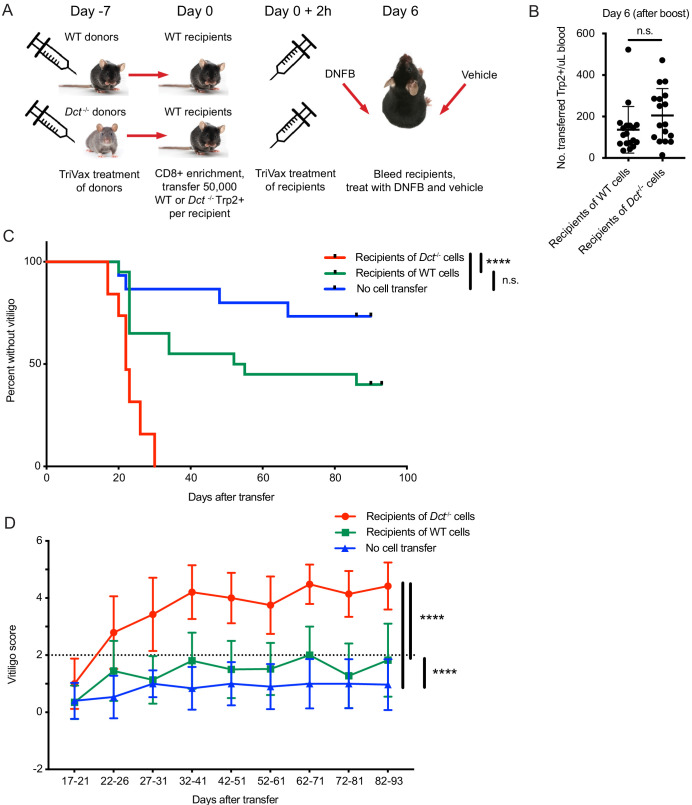
Figure 6—source data 1. Data file related to Figure 6.
elife-65615-fig6-data1.pzfx (251.1KB, pzfx)

Figure 6.

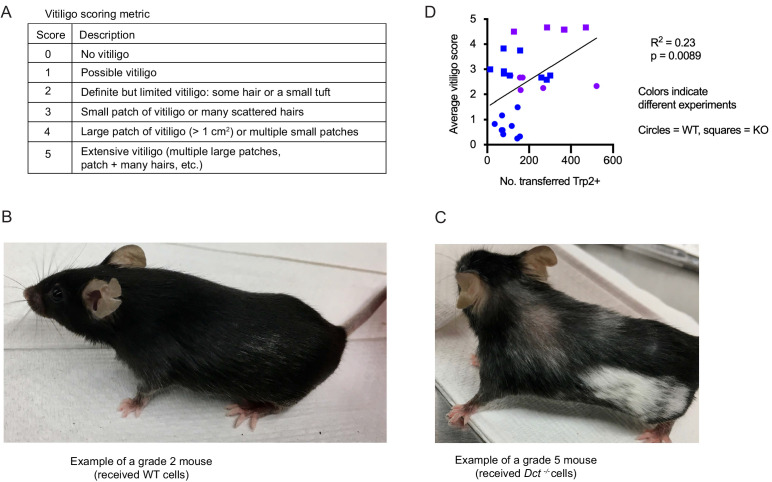
Figure 6—figure supplement 1. Vitiligo scoring metric and correlation between the average vitiligo score and the number of transferred Trp2/Kb-specific cells.

Figure 6—figure supplement 1.

(A) Vitiligo scoring metric used to quantify the degree of vitiligo. (B, C) Examples of vitiligo. (D) Average vitiligo score per mouse (days 0–93) relative to the number of transferred Trp2/Kb tetramer-positive cells on day 6 after transfer and TriVax boost. Two compiled experiments are shown. Simple linear regression was used to fit a line and assign R2 and p-values.
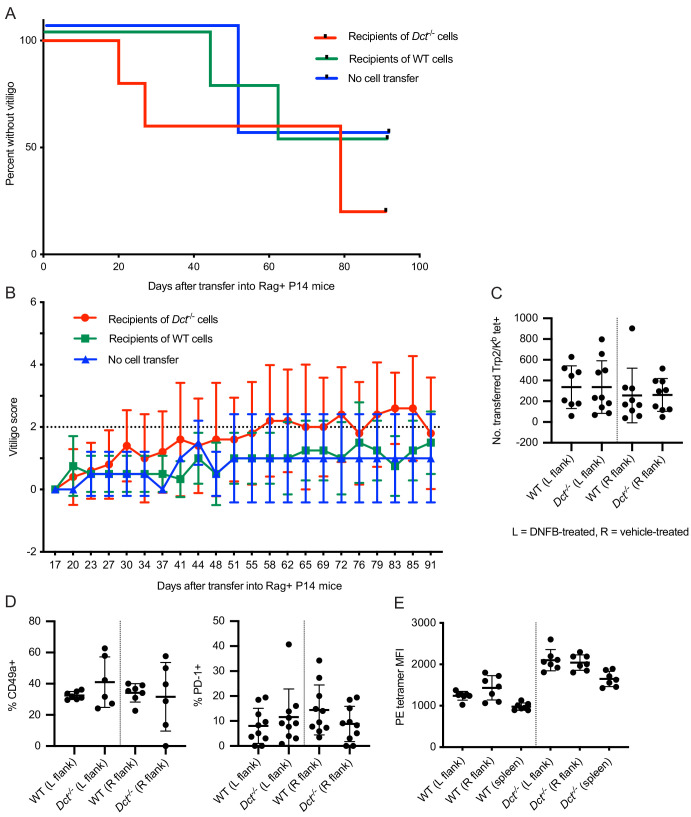
Figure 6—figure supplement 2. Vitiligo development and skin infiltration in P14 mice receiving cell transfers from wild-type (WT) or Dct-/- donors.

Figure 6—figure supplement 2.

Rag-positive P14 T cell receptor (TCR) transgenic mice were monitored for vitiligo after receiving 50,000 Trp2/Kb-specific cells from WT or Dct-/- donors primed with TriVax 7 days prior; recipient mice received TriVax (100 μg Trp2) on the day of transfer and were treated with dinitrofluorobenzene (DNFB) (left flank) 6 days later. No cell transfer controls received TriVax and DNFB but no transferred cells—the low-grade vitiligo observed in those mice presumably coming from P14 T cells that also rearranged endogenous TCRs or tissue damage that did not require antigen-specific T cell responses. (A) Kaplan-Meier curve of vitiligo development; mice were considered to have vitiligo when they first had a vitiligo score of two that was sustained. Mean group vitiligo scores over time are shown in (B), with a dotted line indicating definite vitiligo. Flank skin (~2 cm2) previously treated with DNFB (left) or vehicle (right) was collected from mice sacrificed at day 11 or 12 after cell transfer and processed to a single-cell suspension. The number of transferred Trp2/Kb tetramer-binding cells is shown in (C). (D) The frequency of transferred Trp2/Kb tetramer-binding cells expressing CD49a and PD-1. The tetramer median fluorescence intensity (MFI) of transferred Trp2/Kb tetramer-positive cells in the skin and spleen is presented in E. Data in A and B represent one experiment with four to five mice in the WT and Dct-/- transfer groups and two mice in the no cell transfer group. Data in C and D represent two experiments with three to seven mice per group; data in E represent one experiment with seven mice per group.