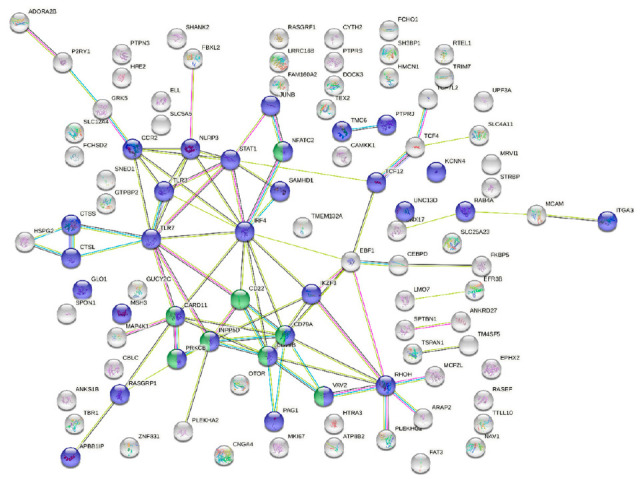
Figure 5.

Protein–protein interaction (PPI) network built by STRING database (PPI enrichment p-value: 1.97 × 10⁻⁹), using as input data the differentially expressed genes shared between turbot with moderate and severe enteromyxosis in comparison to controls. Blue nodes denote proteins implicated in immune system process (GO:0002376). Green nodes denote proteins implicated in the KEGG B cell receptor signaling pathway (hsa04662). Nodes represent proteins, while connecting lines denote interactions between two proteins. Different line colors represent the types of evidence used in predicting the associations: gene fusion (red), gene neighborhood (green), co-expression (black), gene co-occurrence (blue), experimentally determined (purple), from curated databases (teal), text-mining (yellow) or protein homology (lilac).
