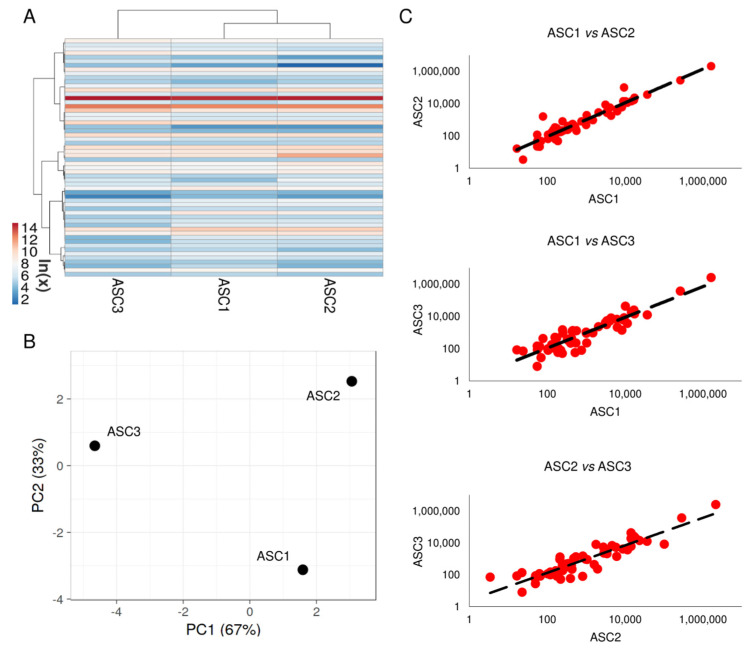
Figure 1.
Comparison of secreted factor profiles between ASCs under study after OA-SF treatment. (A) Heat map of hierarchical clustering analysis of the ln(x) transformed pg/million ASC values of detected factors with sample clustering tree at the top. The color scale reflects the absolute expression levels: red shades = high expression levels and blue shades = lower expression levels. (B) Principal component analysis of the ln(x) transformed pg/million ASC values of detected factors. X and Y axis show principal component 1 and principal component 2 that explain 67% and 33% of the total variance. (C) Correlation of factors expression levels (expressed as pg/million ASC) between the three ASCs under study.

