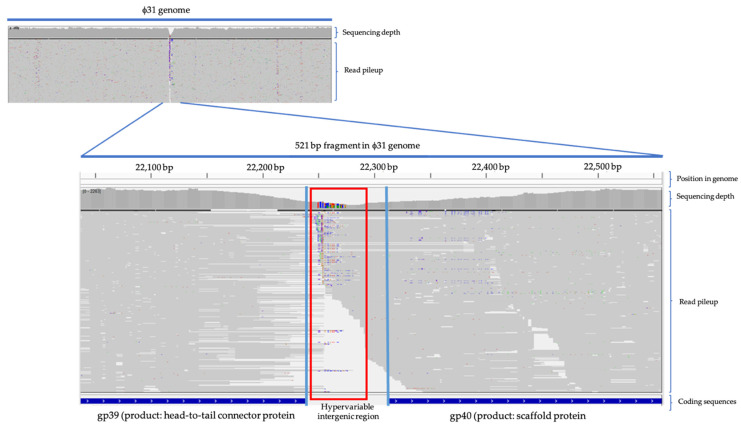
Figure A2.
Read pileup (in grey) of Φ31 with Φ16 as reference. Blue lines at the bottom represent the end and beginning of gp39 and gp40, respectively. The red box indicates the hypervariable region in the intergenic region. There is a clear drop in het read pileup sequencing depth suggesting a deletion event. The remaining reads (each grey line) show an accumulation of mutations (colored dots in the reads) in this specific region.

