Figure 1.
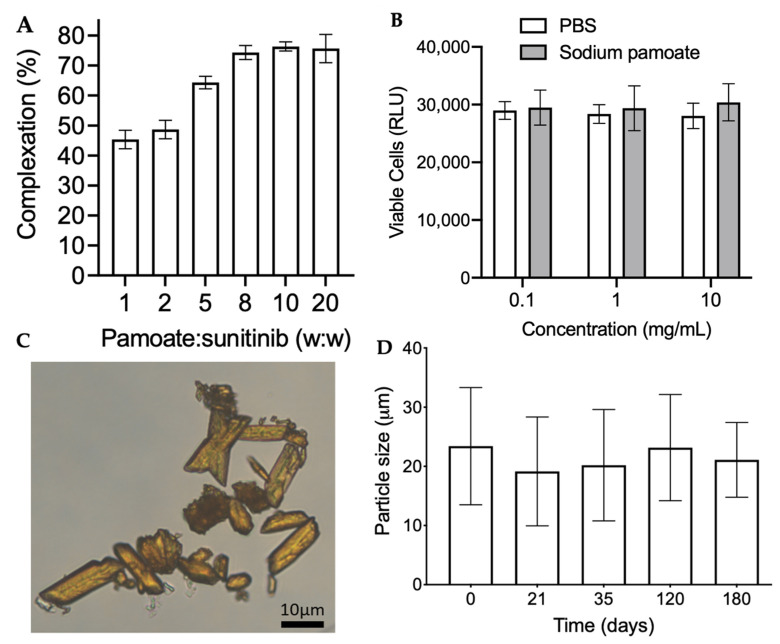
SPC microcrystal characterization. (A) Complexation efficiency of sunitinib malate when mixed at various ratios of pamoic acid to sunitinib (n = 3). Data shown as mean ± SD. (B) Viability of primary mouse RGCs after treatment with sunitinib malate (1 µM) plus either sodium pamoate or PBS (n = 3–5). Data represented as the mean ± SEM. (C) Representative microscopy image of SPC microcrystals. Scale bar = 20 μm. (D) Volume mean size (µm) of SPC microcrystals over a period of 180 days at room temperature (n = 3). Data shown as mean ± SD.

