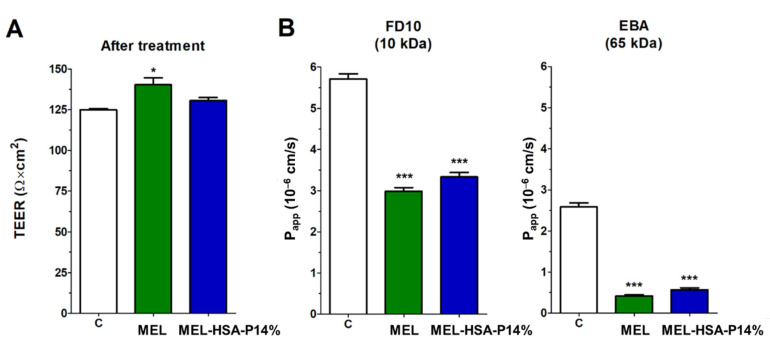
Figure 10.
Transepithelial electrical resistance (TEER) of the co-culture model after a 1-h treatment with MEL and MEL-HSA-P14% (A). Values for paracellular permeability markers fluorescein-labeled dextran (FD10) and Evans blue-labeled albumin (EBA) after a 1-h treatment with MEL and the nano-formulation (B). Values are presented as means ± SD, n = 3. C: control; MEL; MEL-HSA-P14%. * p < 0.05; *** p < 0.001 significantly different from control.

