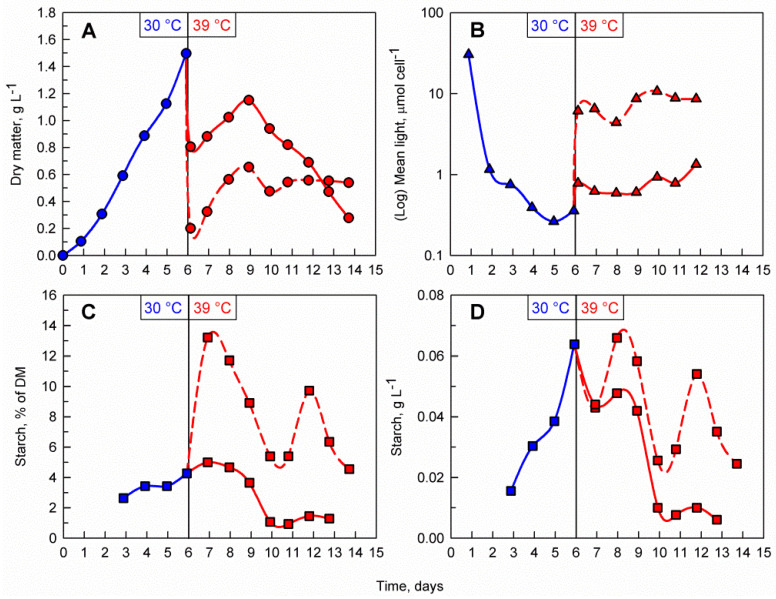
Figure 4.
Effect of different biomass concentrations at the supraoptimal temperature on the time course of dry matter accumulation (A), mean light availability (B), biomass starch content (C), and volumetric starch concentration (D) in the culture. The vertical line at day 6 represents the shift between biomass accumulation and supraoptimal temperature phases. Blue lines and markers indicate cultivation at 30 °C and red lines and markers indicate cultivation at 39 °C. During the biomass accumulation phase a single C. reinhardtii culture was cultivated at 30 °C. After 6 days, the culture was split into two and diluted to 0.2 g L−1 (dashed red line) and 0.8 g L−1 (solid red line) then transferred to 39 °C.

