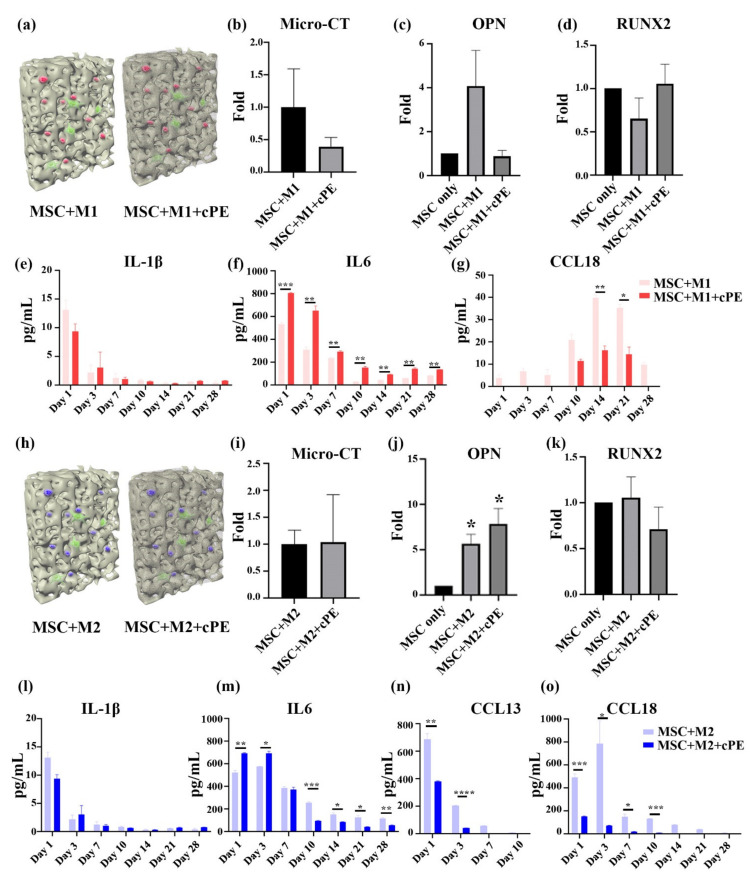
Figure 4.
Effects of macrophage polarization on MSC osteogenesis after 4 weeks of co-culture in 3D scaffolds. (a–g) M1 co-cultures. (a) Cross-sectional illustration of the M1 macrophage–MSCs co-culture. (b) Mineralization of the tissue quantified by micro-CT. (c,d) Osteogenic gene expression analyzed by qPCR. (e–g) Cytokine secretion profiles of IL-1β, IL6, and CCL18 analyzed by ELISA. (h–o) M2 co-cultures. (h) Cross-scheme illustration of the M2 Macrophage–MSCs co-culture. (i) Mineralization of the tissue quantified by micro-CT. (i–k) Osteogenic gene expression analyzed by qPCR. (l–o) Cytokine secretion profiles of IL-1β, IL6, CCL13, and CCL18 analyzed by ELISA. (* p < 0.05, ** p < 0.01, *** p < 0.001, **** p < 0.0001).

