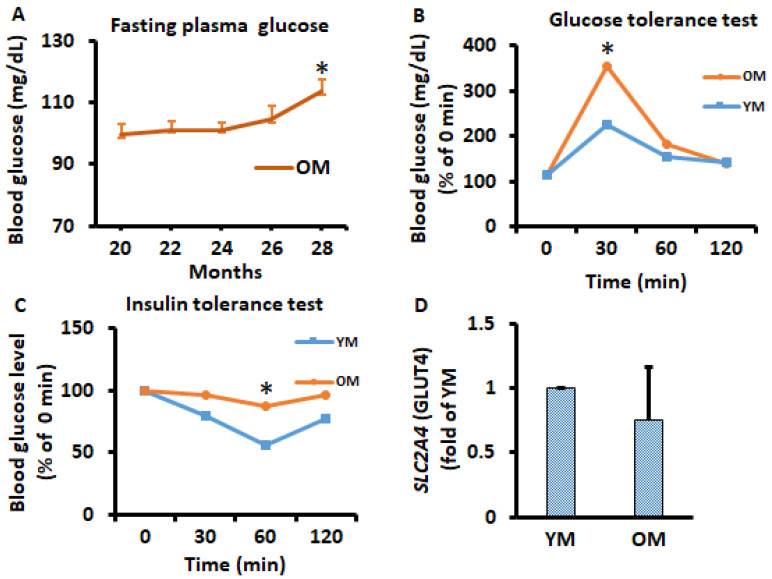
Figure 4.
Time course of potential alterations in metabolism during the aging in vivo study. (A) Overnight fasting glucose was measured every 2 months in OM. (B,C) glucose tolerance tests and insulin tolerance tests were performed on month 9 in YM and month 26 of OM by intraperitoneal injection of glucose (2 g/kg body weight) and insulin (1 U/kg body weight. (D) SLC2A4 (GLUT4) gene expression was analyzed in EWATs from YM and OM using qPCR. Data were analyzed using one-way ANOVA and t-test, and significant differences from one-way ANOVA were further analyzed using Tukey’s test; * p < 0.05 compared to 20-month-old mice or YM.

