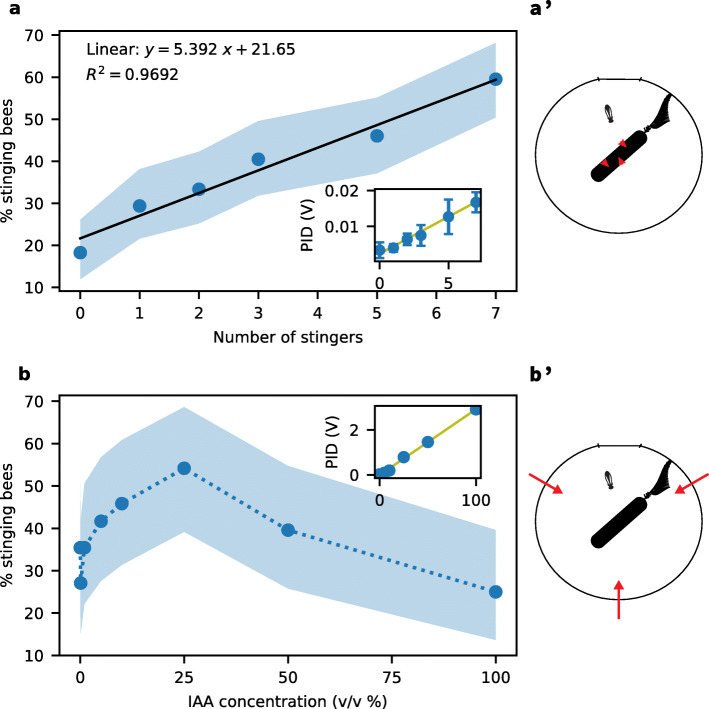
Fig. 1.
Stinging response as a function of the pheromone concentration. a Stinging frequency of a bee as a function of the number of pulled stingers on the dummy. a’ Schematic of the behavioural assay (top view). The bee is facing a rotating dummy inside the arena, on which pulled stingers (red arrowheads) have been placed. b Stinging frequency of a bee as a function of the IAA concentration inside the arena. b’ Schematic of the behavioural assay (top view). The bee is facing a rotating dummy inside the arena, while the alarm pheromone is carried in by three air flows (red arrows). In both graphs, the shaded area corresponds to the 95% confidence interval, estimated from a binomial distribution with our sample size (126 and 72 bees for each point in a and b, respectively). Insets show photoionization detector (PID) measurements of the SAP and IAA concentrations, which are linearly correlated with both the number of stingers and the dilution factor

