Fig. 6.
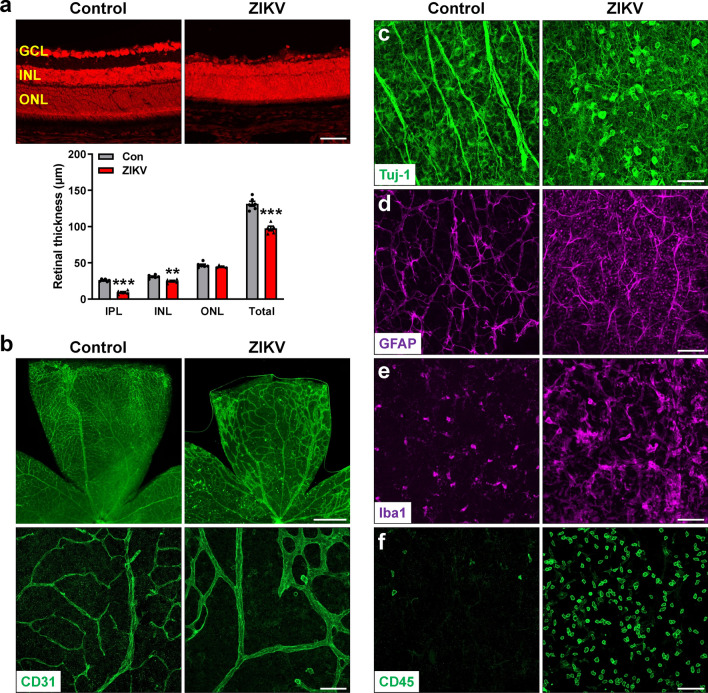
ZIKV further exacerbates retinal degeneration at P14. ZIKV was injected into neonatal mice at P0 and retinas were collected at P14. a Representative images of PI-stained retinal sections at P14. Graph represents the thickness of individual retinal layers and total retina from GCL to ONL. b Representative images of retinal flatmounts labeled with CD31 for vasculature. c–f Representative images of retinal flatmounts labeled with anti-Tuj1 for RGCs and their axons, anti-GFAP for astrocytes, anti-Iba1 for microglia, and anti-CD45 for leukocytes. Scale bar = 50 μm except the upper panel in b where scale bar = 500 μm. Data are presented as mean ± S.E.M. n = 5–6 per group. **p < 0.01, ***p < 0.001 compared to control mice

