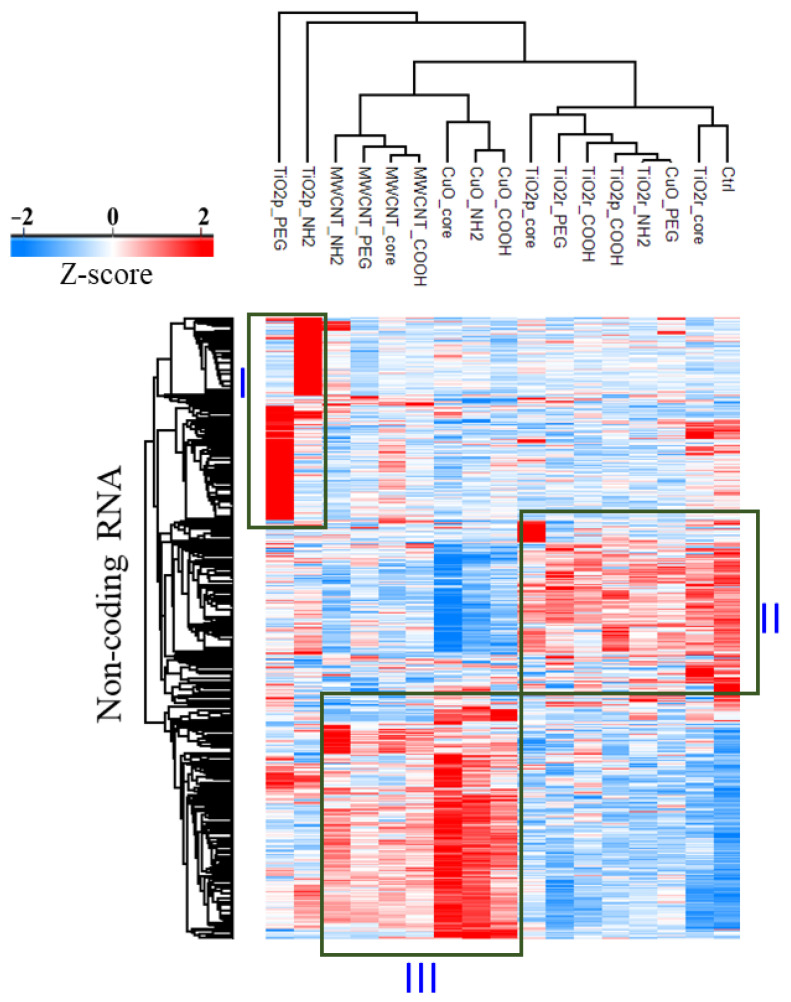
Figure 2.
Heatmap of differentially expressed lncRNA transcripts (1.5-fold change, q-value 0.05). Hierarchical clustering reveals 3 distinct clusters of lncRNAs. Boxes highlight a group of lncRNA transcripts that are upregulated in each cluster (I–III). Each column represents the average Z-scored intensity value from 3 biological replicates.

