Fig. 1.
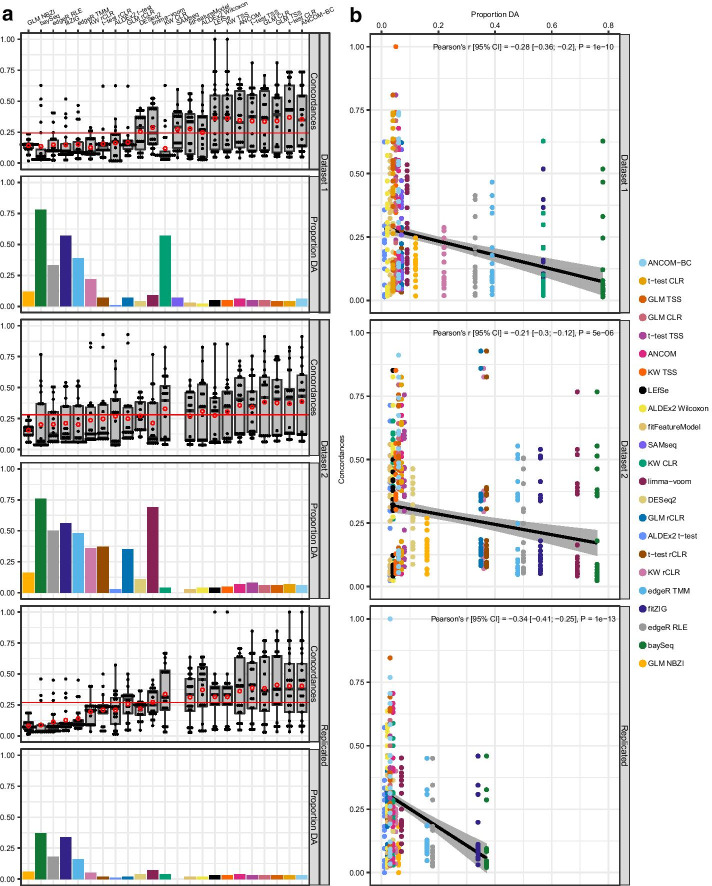
Pairwise concordances and proportion of genera detected as differentially abundant. Differential abundance testing was performed for 445 genera in dataset 1 and 561 genera in dataset 2 using various DA methods. Pairwise concordances (proportion of detected DA signatures in common between two methods out of the total DA signatures detected for those methods) were then calculated for each pair of methods. Column a for each method, the distributions of pairwise concordances and proportion of genera detected as differentially abundant for dataset 1 (top row), dataset 2 (middle row), and for DA signatures that replicated across datasets (bottom row). b The relationship between pairwise concordances and the proportion of genera detected as differentially abundant. Each dot in the boxplots represents a method, plotted according to the concordance it had with the method on the x-axis (22 dots for each method in dataset 1 and 21 dots for dataset 2 and replicated due to SAMseq failing to run for dataset 2). The bottom, middle, and top boundaries of each box in the boxplots represent the first, second (median), and third quartiles of the concordances. The lines extending from the top and bottom of the box extend to points within 1.5 times the interquartile range. Points extending above the whiskers are outliers. Red circles indicate the mean concordance for a method. Horizontal red lines indicate the mean concordance for either dataset 1, dataset 2, or replicated signatures. For dot plots, each concordance value was plotted against the proportion of genera deemed differentially abundant by a method, and a linear trend line (black solid line) was fitted to the data. The grey area surrounding the trend line is the 95% CI of the fitted line. Pearson’s correlation coefficient (r) and corresponding P value (P) were calculated for each dot plot to test strength of the relationship. Concordances: pairwise concordances for each method; Proportion DA: proportion of genera detected as differentially abundant (DA) by a method; GLM: generalized linear model; CLR: centered log-ratio; KW: Kruskal–Wallis; TSS: total sum scaling (relative abundances); rCLR: robust centered log-ratio transformation with matrix completion; RLE: relative log expression; TMM: trimmed mean of M-values; NBZI: negative binomial zero-inflated

