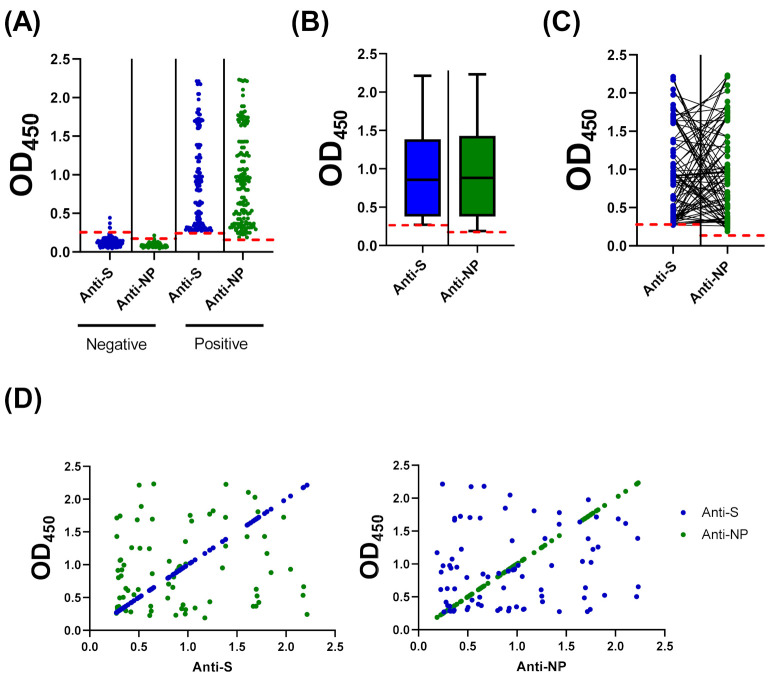
Figure 4.
Compairson and correlation between COVID-19 NP and S IgG ELISAs. (A) Optical density values at 450 nm (OD450) for all negative and positive samples by MN assay using previously develpoed S-based ELISA and the NP-based ELISA protocol optimized in this study. (B) Data distribution of positive samples. Boxes: 25th to 75th percentile range; black line: median; whiskers: Min and Max. (C) OD450 values for each sample as obtained from S- and NP-based ELISAs. (D) Non-significant correlation between S- and NP-ELISAs; r2 = 0.01849, p value = 0.226.

