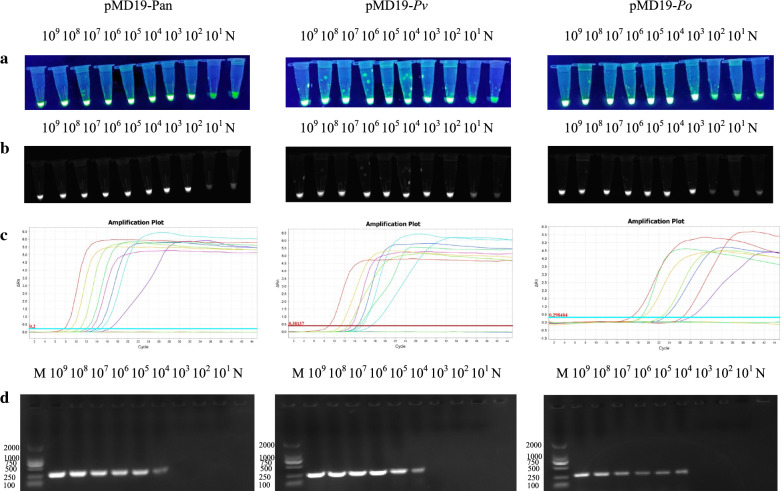
Fig. 2.
LAMP and PCR amplification of serial dilutions of pMD19-Pan, pMD19-Pv and pMD19-Po. a Observation of the green fluorescence by the naked eye under UV light of LAMP amplification from 102 to 109 copies/μl of pMD19-Pan and pMD19-Pv and from 103 to 109 copies/μl of pMD19-Po. b Observation of the white fluorescence image on the Gel imager under UV light of LAMP amplification from 102 to 109 copies/μl of pMD19-Pan and pMD19-Pv and from 103 to 109 copies/μl of pMD19-Po. c Amplification curves of LAMP reactions of amplification from 102 to 109 copies/μl of pMD19-Pan and pMD19-Pv and from 103 to 109 copies/μl of pMD19-Po. d Observation of bands following agarose gel electrophoresis (2% gel) of PCR amplification from 104 to 109 copies/μL of pMD19-Pan, pMD19-Pv and pMD19-Po. ΔRn value is the normalized fluorescence value obtained after deducting the baseline value. M Marker, N negative control

