
Figure 6:
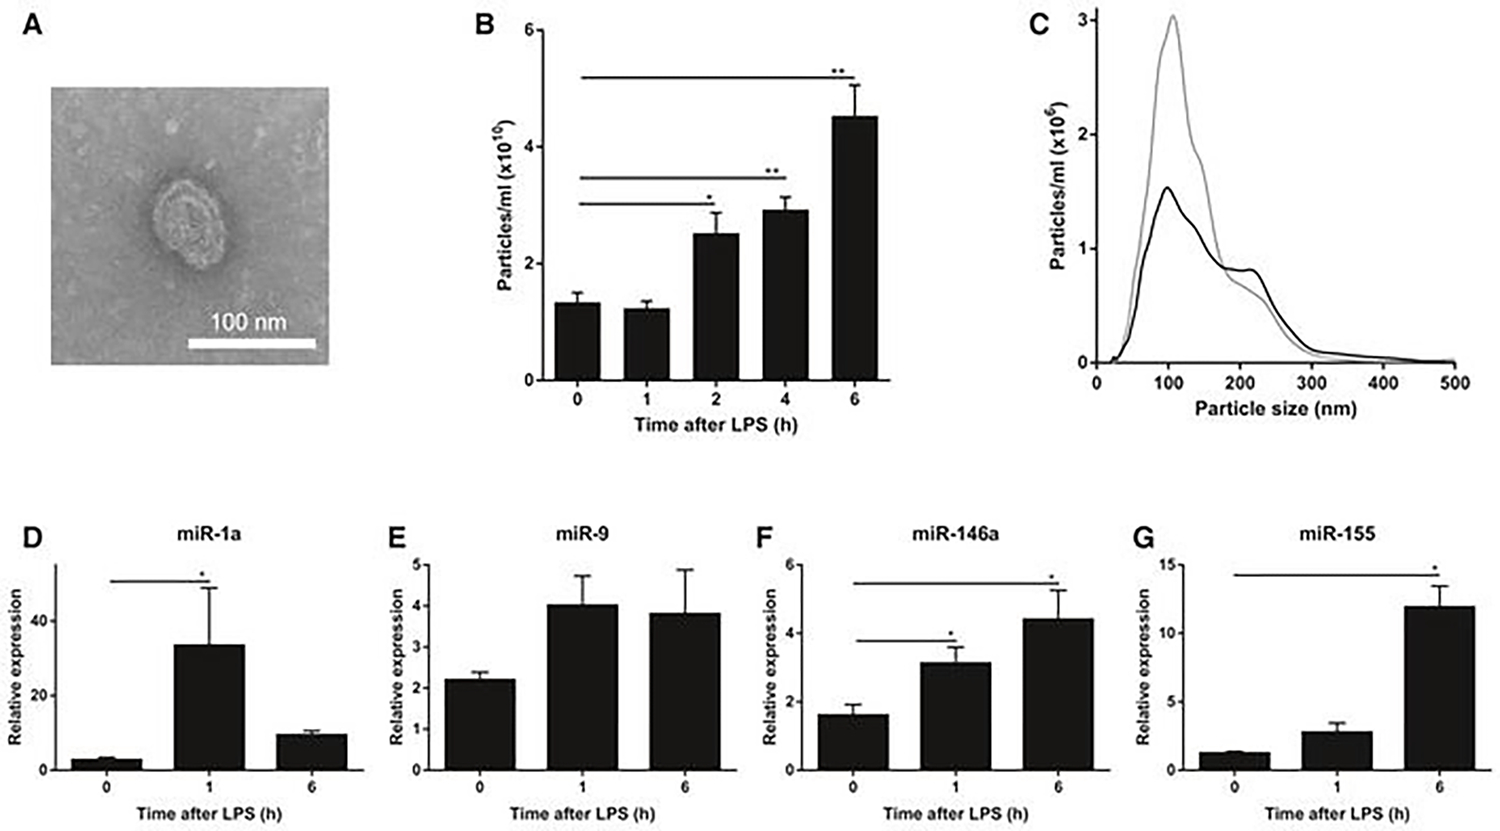
LPS injection induces changes in extracellular vehicles (exosomes) and miRNAs in the cerebrospinal fluid (CSF) A. Representative transmission electron microscope (TEM) image showing the presence of EVs in the CSF in two independent experiments. B. NanoSight quantification of the number of particles in the CSF at 0, 1, 2, 4, and 6 h after i.p. LPS injection (n = 3–5). C. Size distribution of the EVs in vivo in the CSF before (black; n = 5) and 6 h after (gray; n = 3) LPS treatment determined by NanoSight analysis. D–G. Quantitative real-time polymerase chain reaction analysis of miR-1a (D), miR-9 (E), miR-146a (F), and miR-155 (G) (n = 4). RNA was isolated from pooled CSF (50 μl) from different mice (n = 3). Data information: Data in (B, D-G) are displayed as mean ± SEM and analyzed by Student’s t-test. Significance levels are indicated on the graphs: *0.01 ≤ P < 0.05; **0.001 ≤ P < 0.01. Adapted from Balusu et al. (2016) 213, Copyright @ EMBO Press.