
Figure 9:
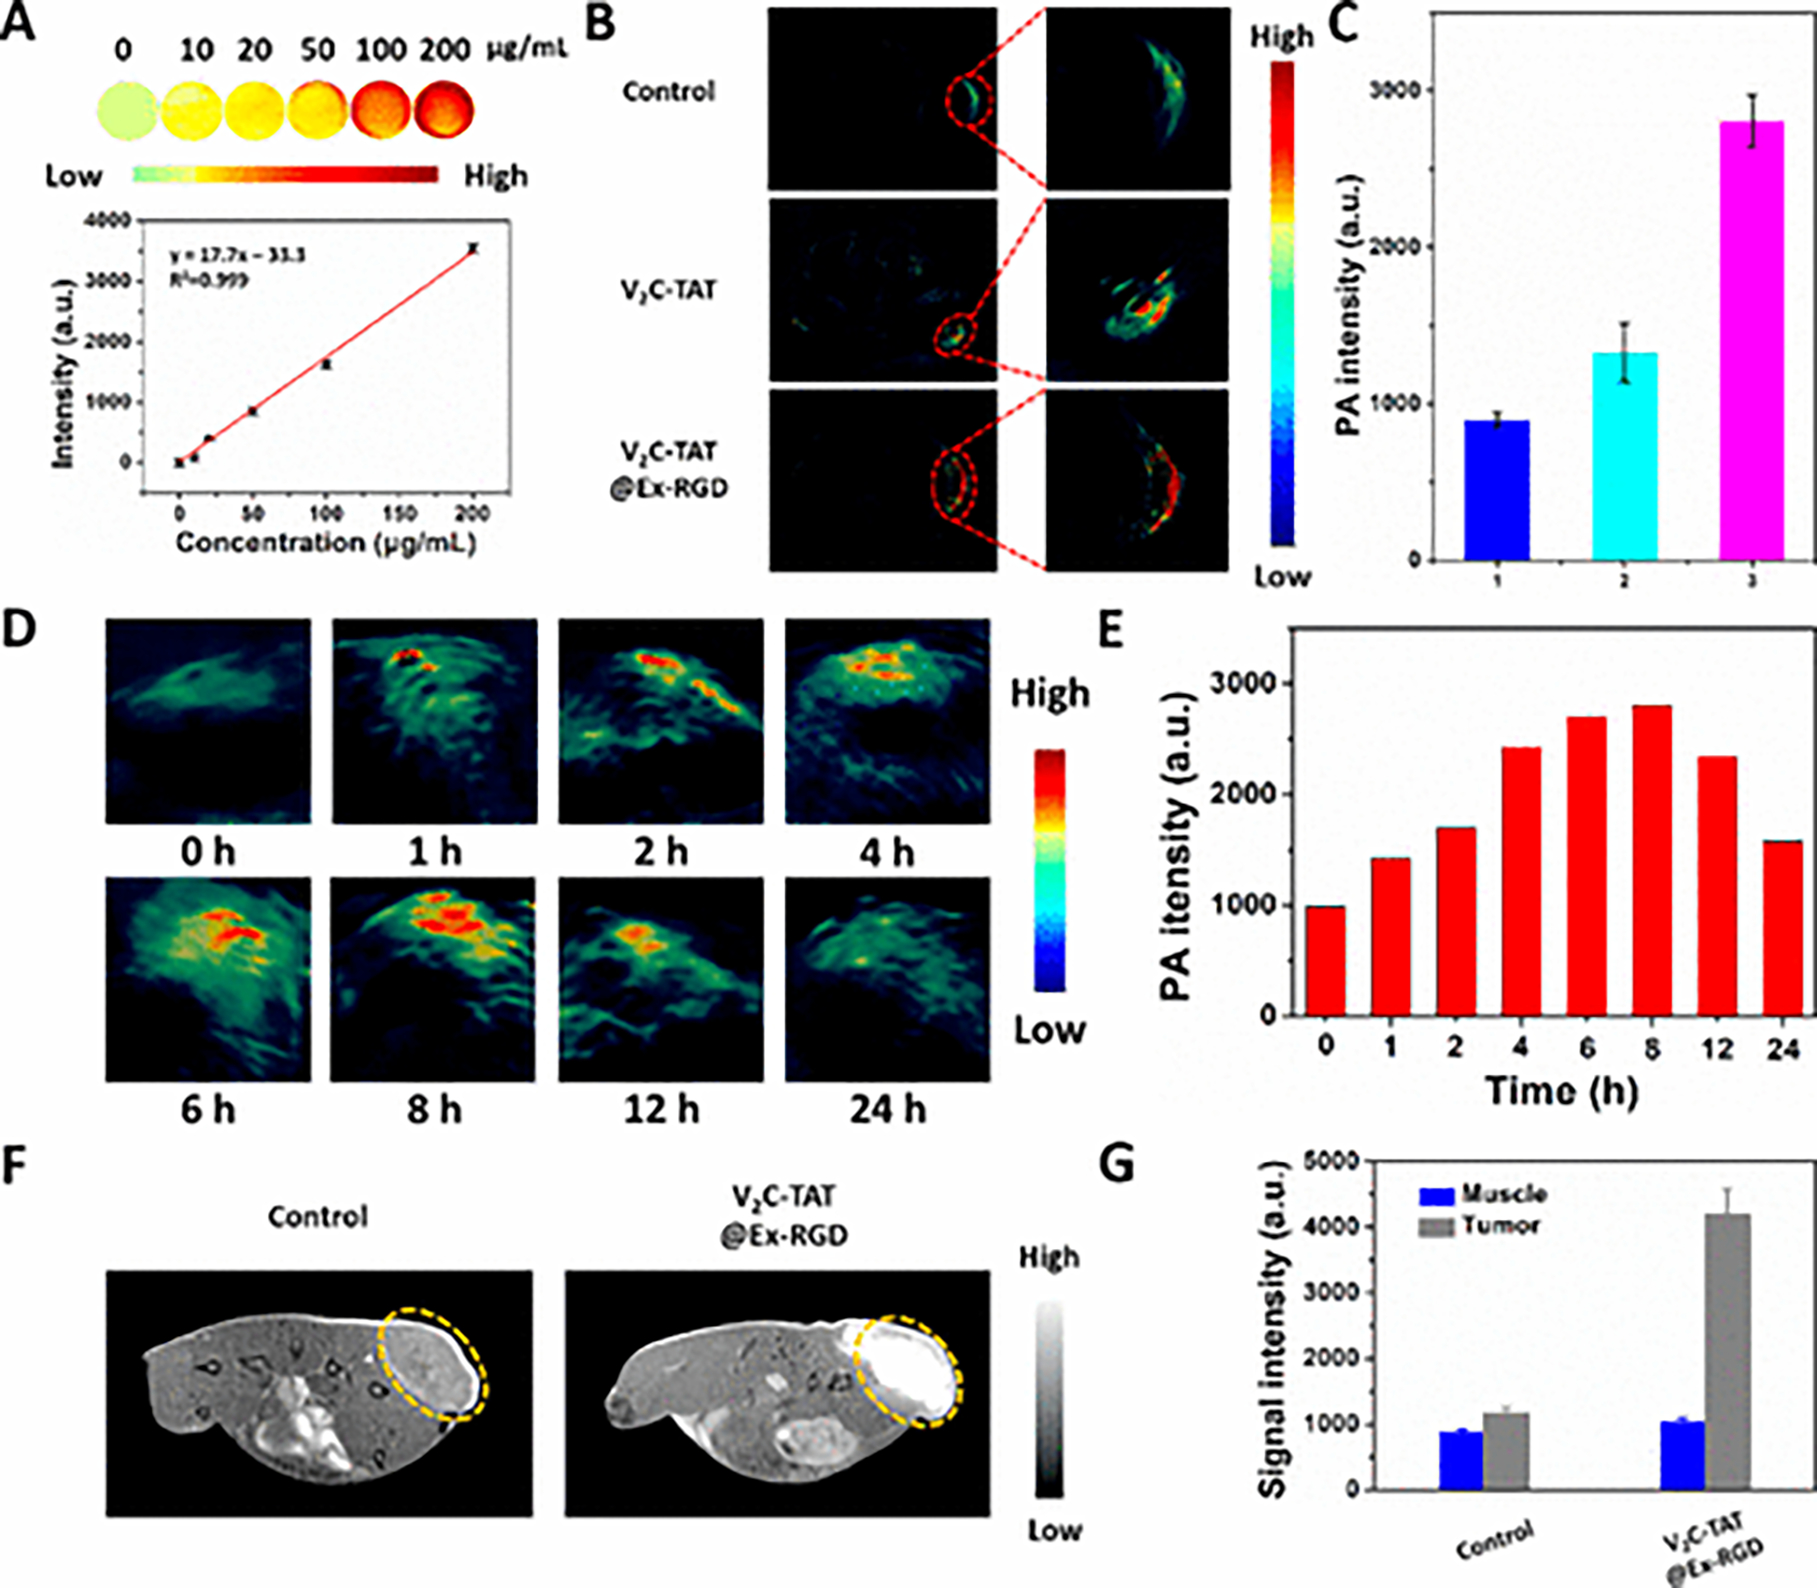
In vitro and in vivo Photoacoustic imaging and Magnetic Resonance Imaging of exosome loaded nanocomposites (V2C-TAT@Ex-RGD) (A) In vitro PAI images and the quantitative curve of PA intensity of the V2C-TAT at different concentrations. (B) In vivo PA images of mice 12 h after intravenous injection of PBS, V2C-TAT (10 mg/kg), and V2C-TAT@Ex-RGD (V2C-TAT, 10 mg/kg). (C) Quantification of the PA signals from the tumor sites from different groups treated with (1) PBS, (2) V2C-TAT (10 mg/kg), and (3) nanocomposites (V2C-TAT, 10 mg/kg). (D, E) In vivo PA images and the responding signal intensities of mice at different times after intravenous injection of nanocomposites (V2C-TAT, 10 mg/kg). (F) T1-weighted MR images of mice 24 h after intravenous injection of PBS, V2C-TAT (V2C-TAT, 10 mg/kg), and nanocomposites (V2C-TAT, 10 mg/kg). (G) Quantification of the MR signals from the tumor sites from different groups. Adapted from Cai et al (2019) 358, Copyright @2019, American Chemical Society.