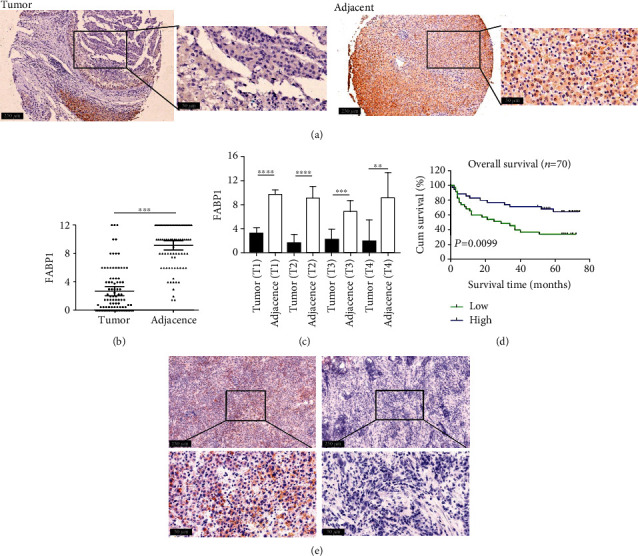
Figure 1.

FABP1 expression in HCC and adjacent tissues. (a) Representative image of FABP1 staining by IHC in HCC tissue and the corresponding adjacent tissue array. The images of low-power field of view were magnified 100-fold, as shown in the left panel, scale bar = 250 μm, and the images in the boxes were magnified 400-fold, as shown in the right panel, scale bar = 50 μm. The FABP1-positive tissue was stained in brown. (b) FABP1 staining index in the tissue array. Data are expressed as the means ± SD, n = 90 for each group. ∗∗∗P < 0.001. (c) FABP1 staining score in four clinical stages of HCC and adjacent tissues. Data are expressed as the means ± SD, n = 37 for T1, n = 28 for T2, n = 15 for T3, and n = 10 for T4. ∗∗P < 0.01, ∗∗∗P < 0.001, and ∗∗∗∗P < 0.0001. (d) Survival curve generated by the Kaplan-Meier analysis in patients with high and low FABP1 expression (n = 70). (e) Representative image of fatty acid staining by Oil Red O staining in HCC tissue and the corresponding adjacent tissues. Images in the upper panel were magnified 100-fold, scale bar = 250 μm. The images in the boxes were magnified 400-fold, as shown in the bottom panel, scale bar = 50 μm.
