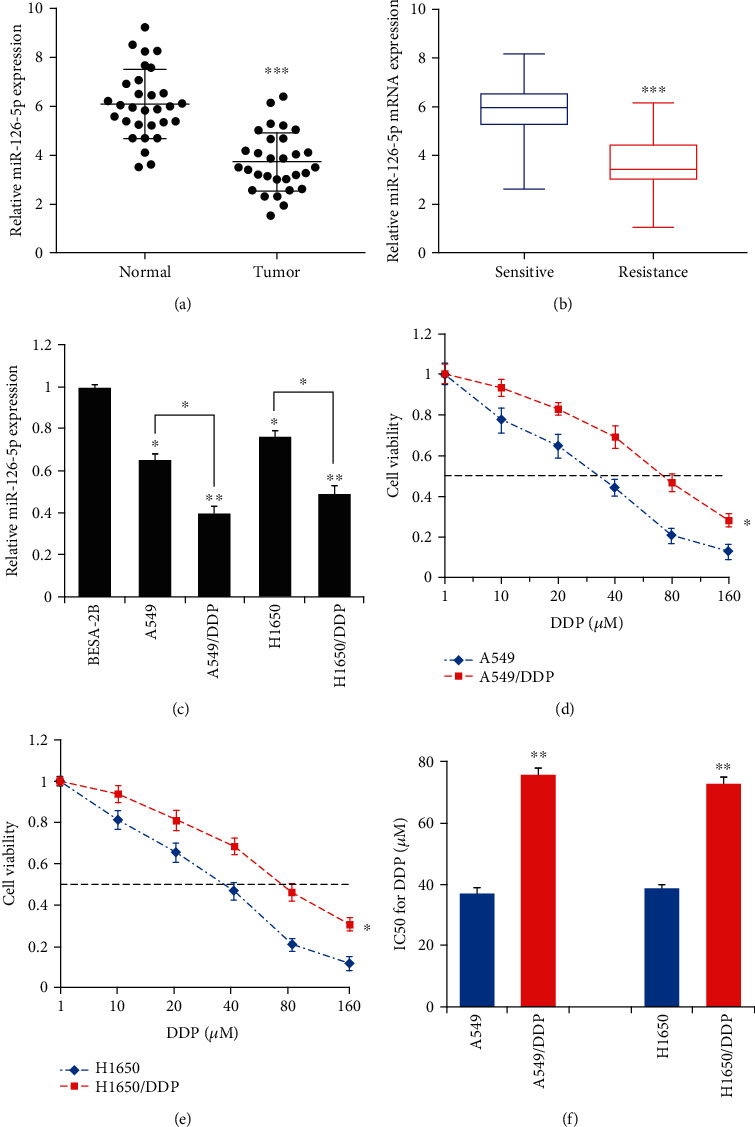
Figure 1.

A correlation between miR-126-5p expression and cisplatin sensitivity of NSCLC: (a) miR-126-5p levels in NSCLC tumor tissues (n = 30) and the nontumor counterparts (n = 30); (b) miR-126-5p levels in NSCLC sensitive (n = 15) and resistance groups (n = 15); (c) miR-126-5p levels in BESA-2B, A549, A549/DDP, H1650, and H1650/DDP groups; (d) MTT assay-based detection of IC50 values in A549 and A549/DDP groups; (e) MTT assay-based detection of IC50 values in H1650 and H1650/DDP groups; (f) quantitative and statistical analysis of IC50 for each group. ∗P < 0.05, ∗∗P < 0.01, and ∗∗∗P < 0.001.
