Fig. 2.

Distribution of D-dimer and FDP values
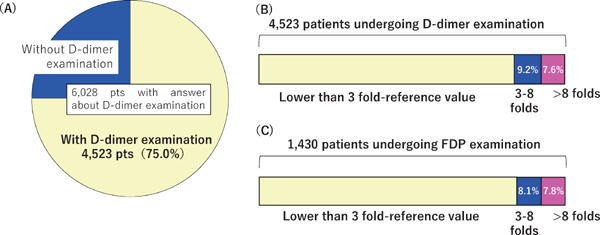
The proportion of patients with D-dimer assessments (A) and maximal values of D-dimer (B) and FDP (C) during hospitalization.

Distribution of D-dimer and FDP values
The proportion of patients with D-dimer assessments (A) and maximal values of D-dimer (B) and FDP (C) during hospitalization.