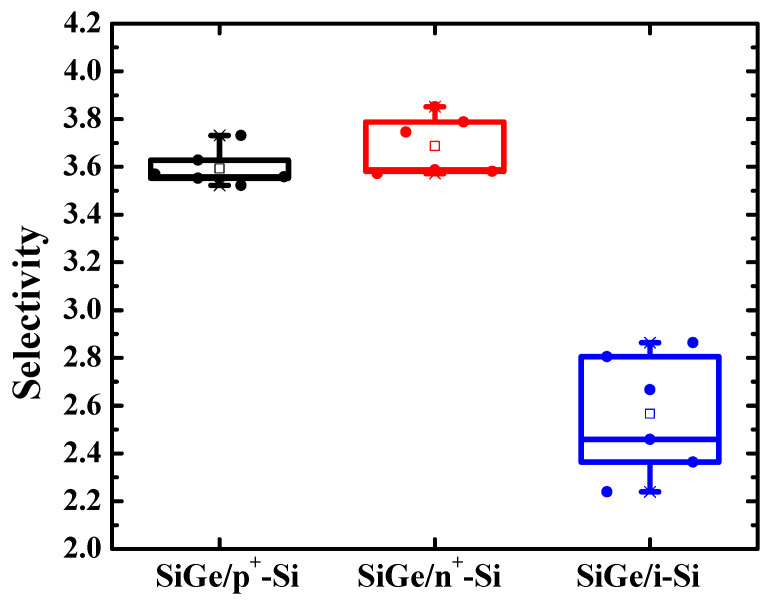
Figure 7.
Box plot of the selectivity of SiGe/n+-Si, SiGe/p+-Si, and SiGe/i-Si. The means and the standard deviations are 3.59, 3.68, and 2.56 and 0.0759, 0.1228, and 0.2512, respectively. Significant improvements in the selectivity for doped Si were observed. The selectivity of SiGe/n+-Si and SiGe/p+-Si was similar, but the variation in SiGe/n+-Si was larger.

