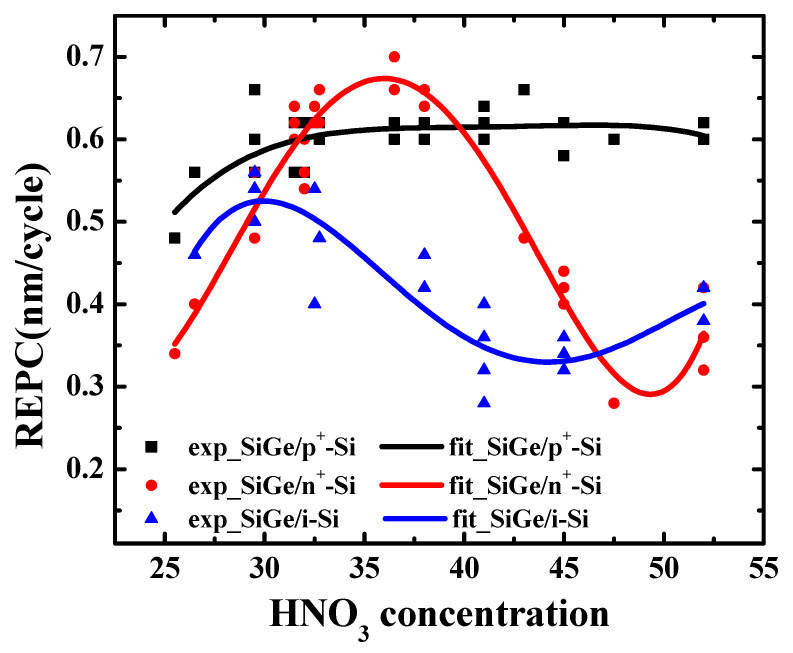
Figure 8.
REPC of SiGe/n+-Si, SiGe/p+-Si, and SiGe/i-Si as a function of HNO3 concentration. The dots in the figure are the experimental data, and the lines are the fitting curves of the experimental data. The slopes represent the relative etching amount per cycle (REPC) and the etching amount per cycle (EPC) of silicon.

