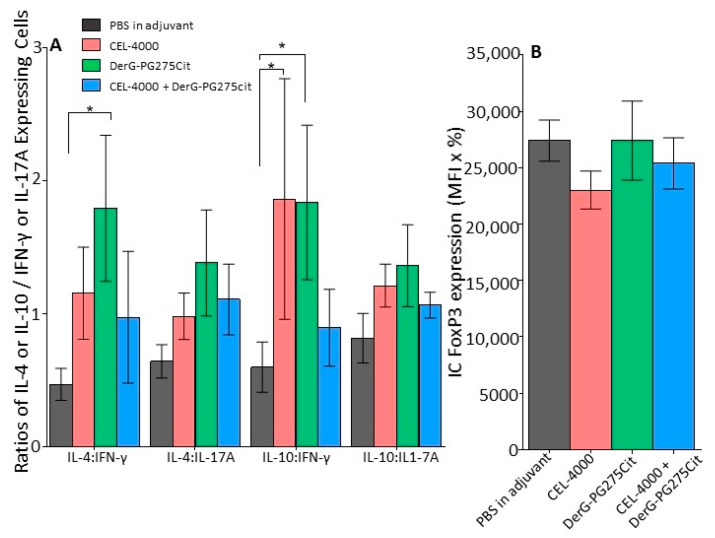
Figure 7.
Intracellular (IC) cytokine and FoxP3 expression of spleen cells from control and LEAPS vaccine treated GIA mice. Spleen cells collected from the GIA mice at the end of study 2 were analyzed by flow cytometry for IC expression of cytokines or the Treg marker FoxP3. Expression data were calculated by multiplying mean fluorescence intensity (MFI) by the percent (%) of cytokine- or FoxP3 positive CD4+ T cells. (A) Ratios of anti-inflammatory (IL-4 or IL-10) to pro-inflammatory (IL-17A or IFN-γ) cytokines detected inside the GIA CD4+ cells. (B) IC FoxP3 expression in CD4+ spleen cells of each group of mice (MFI × %). Statistical analysis of the IC staining data was performed using (A) 2-way ANOVA with Fisher’s LSD test or (B) Kruskal–Wallis test with Dunn’s multiple comparison (n = 5 mice per group, * p ≤ 0.05).

