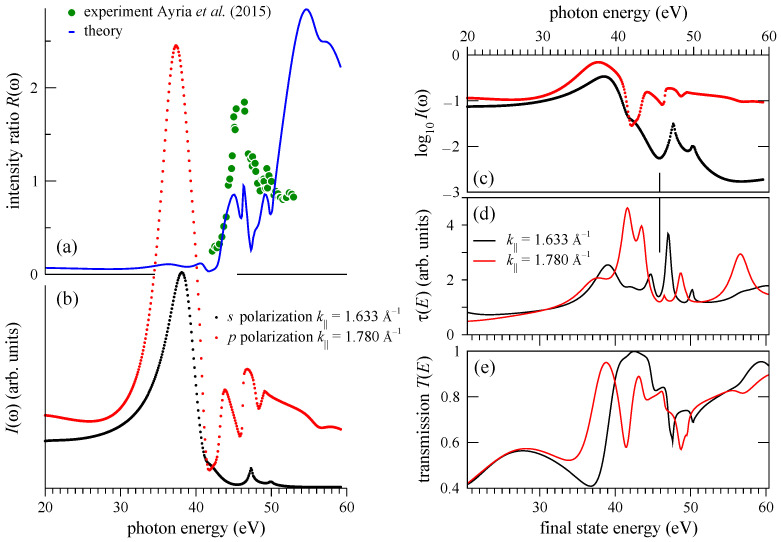
Figure 4.
(a) Photon energy dependence of the relative intensity , see Equation (4), of the emission from the state () at Å and state () at Å for the polarization angle (4.3% of p and 95.7% of s polarization). Both initial states are located at about 0.4 eV above the DP. Full circles show the measurements of Ref. [18] (digitized from Figure 5 in that work). (b) Calculated constant initial state spectra (black) and (red). (c) Logarithmized intensities (black) and (red). (d) Dwell time : The probability to find the electron in the LEED state within a layer between and 2 a.u., see Figure 1. The final state energy E is relative to the DP. (e) Electron transmission for Å (black) and Å (red). To facilitate the comparison, the E range in graphs (d) and (e) is shifted by 0.4 eV (initial state energy) relative to the range in graph (c).

