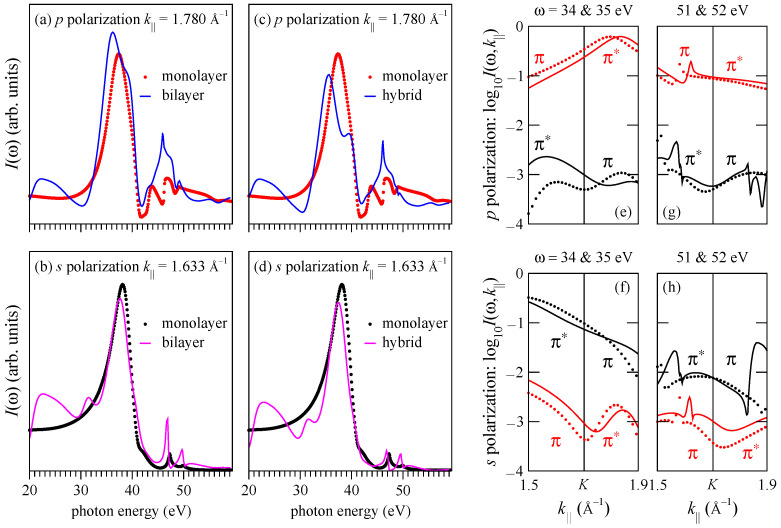
Figure 7.
(a,b) Comparison of the CIS spectra for the monolayer (dots) and bilayer graphene (lines): (a) p polarization, (b) s polarization. The bilayer curves are a sum of the and spectra, see Figure 2b for notation. (c,d) Comparison of the monolayer (dots) and hybrid-model (lines) CIS spectra: (c) p polarization, (d) s polarization. The monolayer curves in graphs (a,c) and (b,d) are the same as the curves of the respective colors in Figure 4b. (e,f,g,h) Contrast between the and branches by the hybrid model. Crystal-momentum dependence of the intensity from the and states of the (red) and (black) branch for four photon energies: (e,f) eV (lines) and 35 eV (dots); (g,h) eV (lines) and 52 eV (dots) for p polarization (e,g) and s polarization (f,h).

