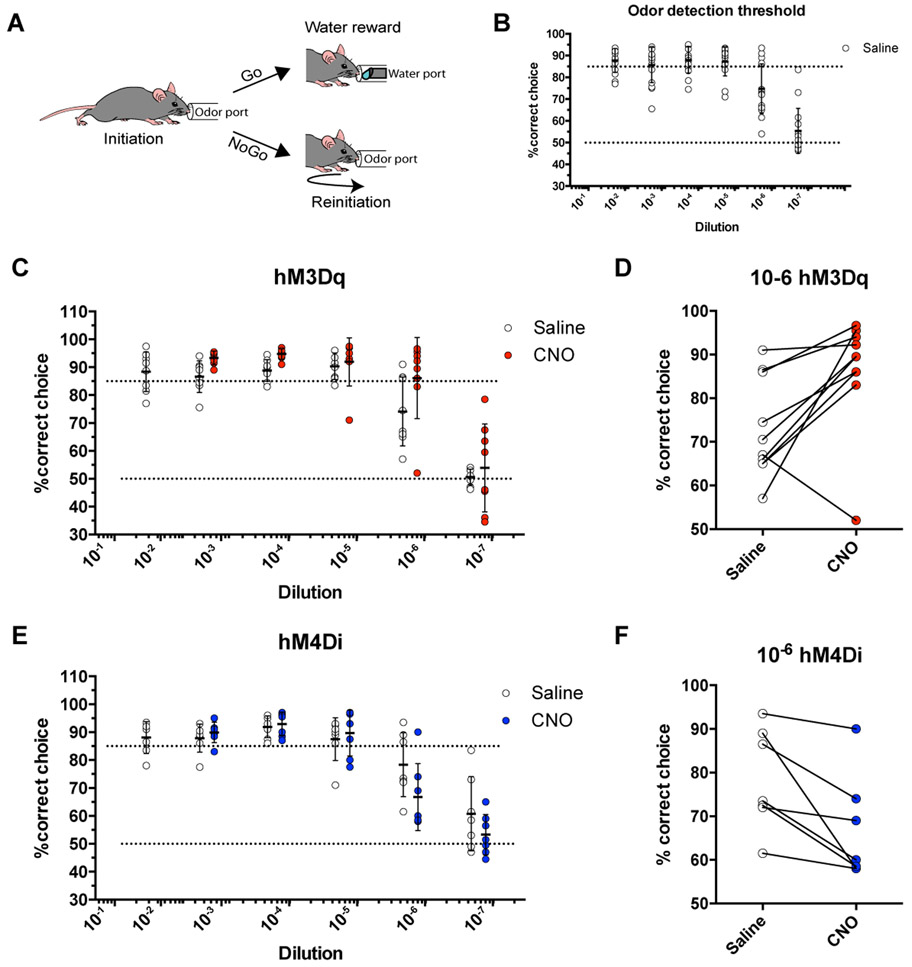
Figure 4. Astrocytic calcium directly affected olfactory behavior.
(A) Schematic of olfactory-associated Go-NoGo behavioral task.
(B) Odor detection curve in n = 8 male and 8 female control mice. Mice were reliably able to detect odors at 10−5 (v/v) and performed approximately at chance at 10−7.
(C) Odor detection curve in n = 4 male and 6 female mice expressing hM3Dq. Black lines represent the detection curve before CNO treatment while red lines represent odor detection curve after CNO treatment.
(D) At the concentration in which performance was most sensitive (10−6), Gq-mediated astrocyte activity increased performance in detecting and responding to odorant cues. n = 4 male and 6 female mice. *p = 0.0149, Paired Student’s t-test.
(E) Odor detection curve in n = 4 male and 3 female mice expressing hM4Di. Black lines represent the detection curve before CNO treatment while red lines represent odor detection curve after CNO treatment.
(F) At the concentration in which performance was most sensitive (10−6), Gi-mediated astrocyte activity decreased performance in detecting and responding to odorant cues. n = 4 male and 3 female mice. *p = 0.0216, Paired Student’s t-test.

