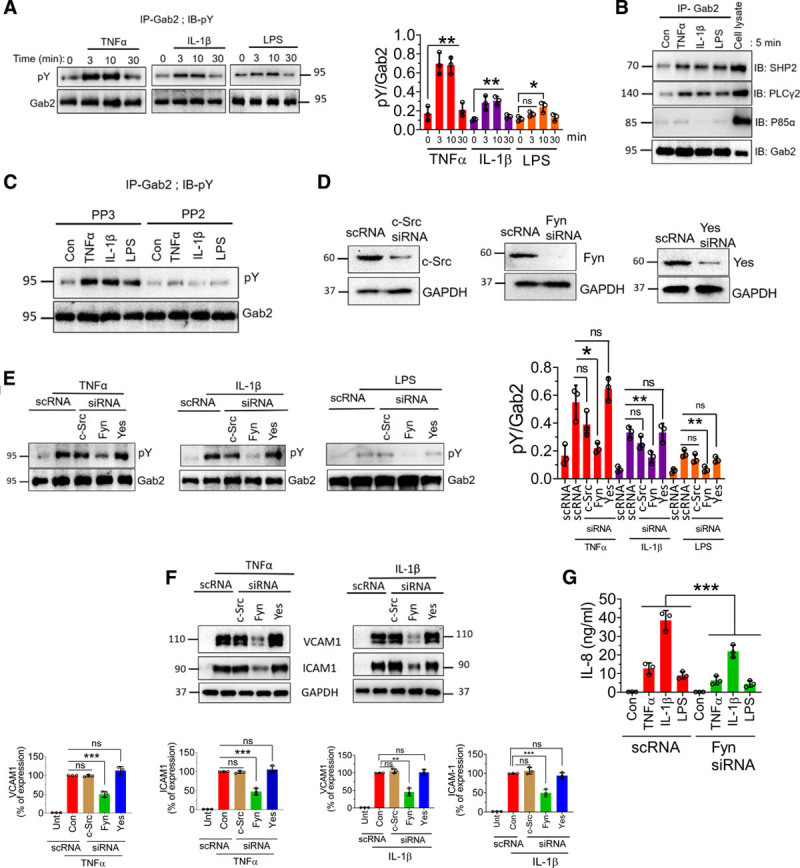
Figure 4.

TNFα (tumor necrosis factor alpha), IL (interleukin)-1β, and lipopolysaccharide (LPS) induce the phosphorylation of Gab2 (Grb2-associated binder2) and association of Gab2 with its interacting partners, SHP2 (SH2 containing protein tyrosine phosphatase-2) and PLCγ (phospholipiase C gamma). A, Human umbilical vein endothelial cells (HUVECs) were treated with TNFα (10 ng/mL), IL-1β (10 ng/mL), or LPS (500 ng/mL) for the indicated times. The cells were lysed in the radioimmunoprecipitation assay buffer containing protease inhibitors. Gab2 was immunoprecipitated (IP) using the Gab2 polyclonal antibody, followed by protein A/G agarose bead pull-down. The Gab2 immunoprecipitates were subjected to immunoblot analysis (IB) and probed with a phosphotyrosine (pY)-specific monoclonal antibody to evaluate the phosphorylation of Gab2. Band intensities were quantified by densitometry, and these data are shown in the right. B, HUVECs were treated with the TNFα (10 ng/mL), IL-1β (10 ng/mL), LPS (500 ng/mL), or a control vehicle for 5 min. The Gab2 was immunoprecipitated, and the immunoprecipitates were probed for SHP2, PLCγ, or P85α by immunoblot analysis using specific monoclonal antibodies against SHP2, PLCγ, or P85α. C, HUVECs were incubated with Src inhibitor PP2 (10 µmol/L) or its inactive analog PP3 (10 µmol/L) for 1 h. Then, the cells were treated with the agonists for 5 min. The Gab2 was immunoprecipitated and probed with a pY monoclonal antibody to evaluate the tyrosine phosphorylation of Gab2. D, HUVECs were transfected with 200 nmol/L of scrambled siRNA (scRNA) or siRNA specific for c-Src, Fyn, or Yes. After 48 h, the cell lysates were harvested and probed for expression of c-Src (cellular Src), Fyn, or Yes in immunoblot analysis. E, HUVECs transfected with a scrambled siRNA or siRNA specific for c-Src, Fyn, or Yes were treated with TNFα (10 ng/mL), IL-1β (10 ng/mL), or LPS (500 ng/mL) for 5 min. Gab2 was immunoprecipitated and probed for tyrosine phosphorylation using the pY monoclonal antibody in immunoblot analysis. Band intensities were quantified by densitometry, and these data are shown in the right. F, HUVECs transfected with scRNA, c-Src, Fyn, or Yes siRNA were treated with TNFα (10 ng/mL) and IL-1β (10 ng/mL) for 6 h. VCAM1 (vascular cell adhesion molecule 1) and ICAM1 (intercellular adhesion molecule 1) levels were analyzed by immunoblotting, and band intensities were quantified by densitometry, and these data are shown in the bottom. G, HUVECs transfected with scRNA or Fyn siRNA were treated with TNFα (10 ng/mL), IL-1β (10 ng/mL), or LPS (500 ng/mL) overnight, and IL-8 levels in cell supernatants were determined in ELISA. One-way ANOVA was used to compare the data of experimental groups; Tukey post hoc multiple comparison test was used to obtain statistical significance. ns indicates no statistically significant difference. ***P<0.001, **P<0.01, *P<0.05. Con indicates control; and Unt, untreated.
