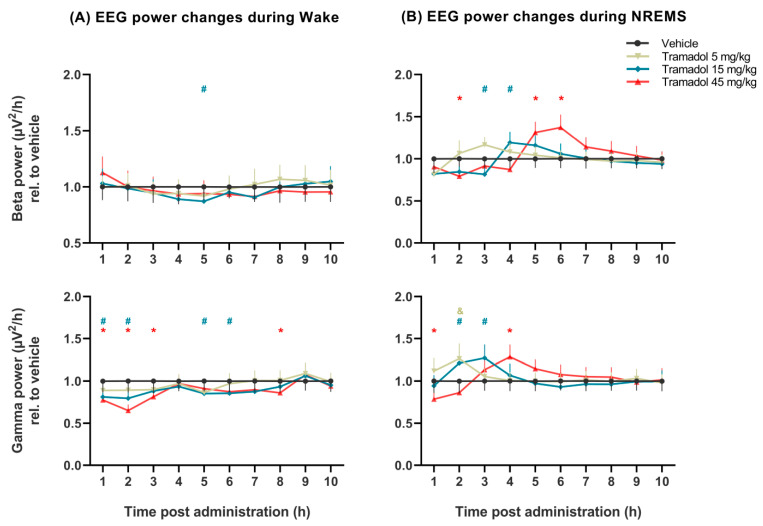
Figure 4.
Beta and gamma EEG power changes induced by tramadol (5, 15 and 45 mg/kg i.p.) during (A) wakefulness and (B) non-rapid eye movement sleep (NREMS) compared to vehicle (presented as value 1.0 with the calculated SEM for each hour). EEG power data were averaged for each hour after administration of vehicle or tramadol at the beginning of the passive phase. The &, # and * signs indicate significant post hoc results (p < 0.05) compared to vehicle in case of the 5, 15 and 45 mg/kg tramadol-treated groups, respectively. Data are presented as SEM (n = 8 rats/group).

