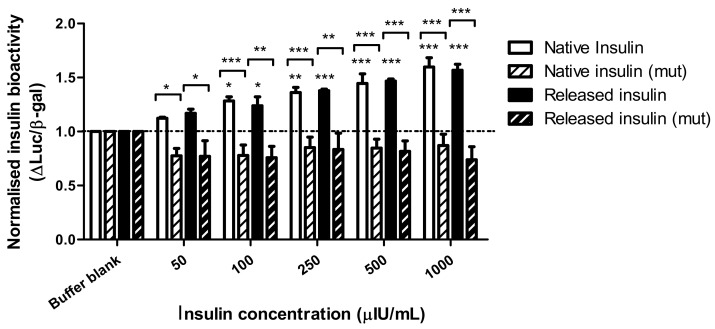
Figure 5.
The ratio of luciferase and β-galactosidase expression in endogenous insulin receptor-expressing HepG2 cells transfected with wt (SynSRE-T-Luc) or mutant (mut, SynSRE-T-mut-Luc), following exposure to native and bead-released insulin. Data are presented as mean ± SEM, n = 3 individual bead batches. * p < 0.05, ** p < 0.01, *** p < 0.001 compared to buffer blank. Bracketed values compared responses from enriched and mutant cells.

