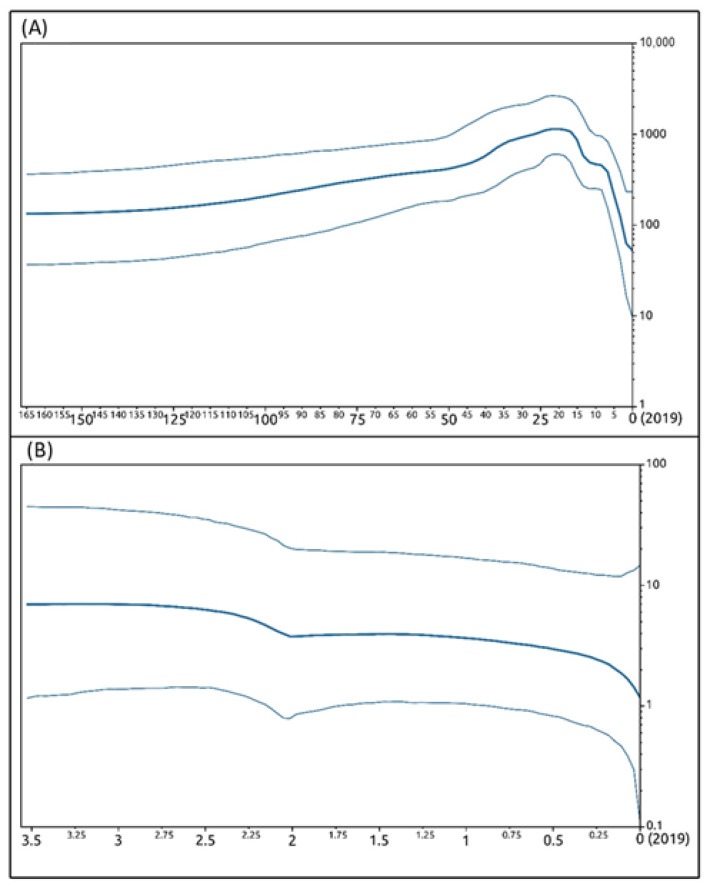
Figure 8.
Bayesian skyline plots. Bayesian skyline plots depicting the evolutionary history of ORFV VIR gene. The effective population size of viral infection (y-axis) is shown as a function of time (x-axis), with the units expressed as years. (A) VIR global dataset; (B) VIR regional dataset encompassing only Sardinian sequences. The bold lines denote the median effective number of infections and the thin lines (placed above and below the median value line) demarcate the 95% highest posterior density (HPD) confidence interval.

