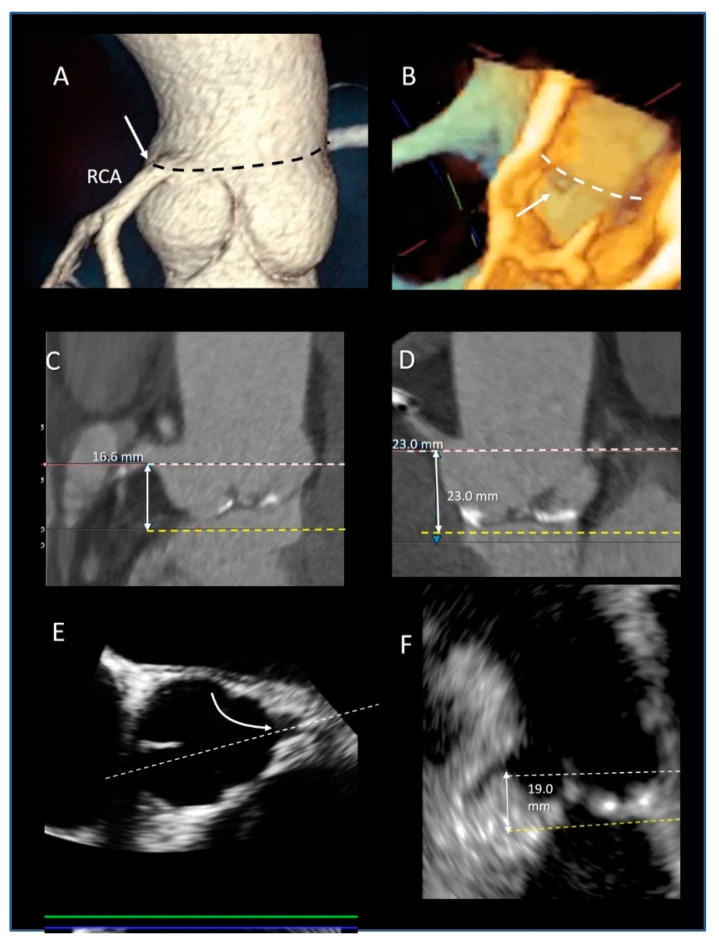
Figure 10.
(A) CT Volume rendering modality showing the origin of right coronary artery arise at the level of sinutubular junction (black dotted line). (B) The 3D TEE longitudinal cross-section showing the orifice of coronary artery (arrow) at level of sinutubular junction (white dotted line). (C,D) CT multiplanar image modality showing the measurements of the distance (double-headed arrow) between the coronary ostia (white dotted line) and the virtual annulus (yellow dotted line). (E) The 2D TEE multiplanar reconstruction derived by 3D data set in short-axis view of the aorta showing the orifice of LAD (curved arrow). The white dotted line indicates the longitudinal cross-section plane that shows the image of the panel. (F) From this image, the distance between the coronary ostia (white dotted line) and the virtual annulus (yellow dotted line) can be measured (double-headed arrows).

