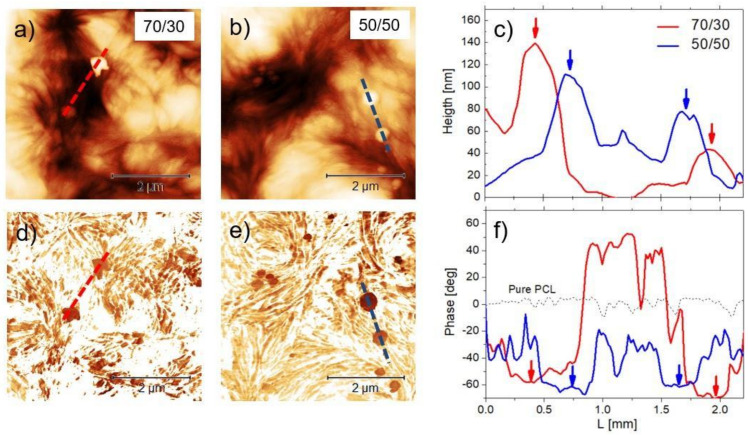
Figure 4.
(a,b) 5 × 5 µm2 AFM height images of the 70/30 and 50/50 formulations with (c) cross-sectional traces taken on the two particles. (d,e) Phase images corresponding to the topographies above and (f) corresponding cross-sectional traces, including the signal corresponding to pure PCL. Arrows are a guide for the eye, indicating height maxima and corresponding phase minima in the two formulations.

