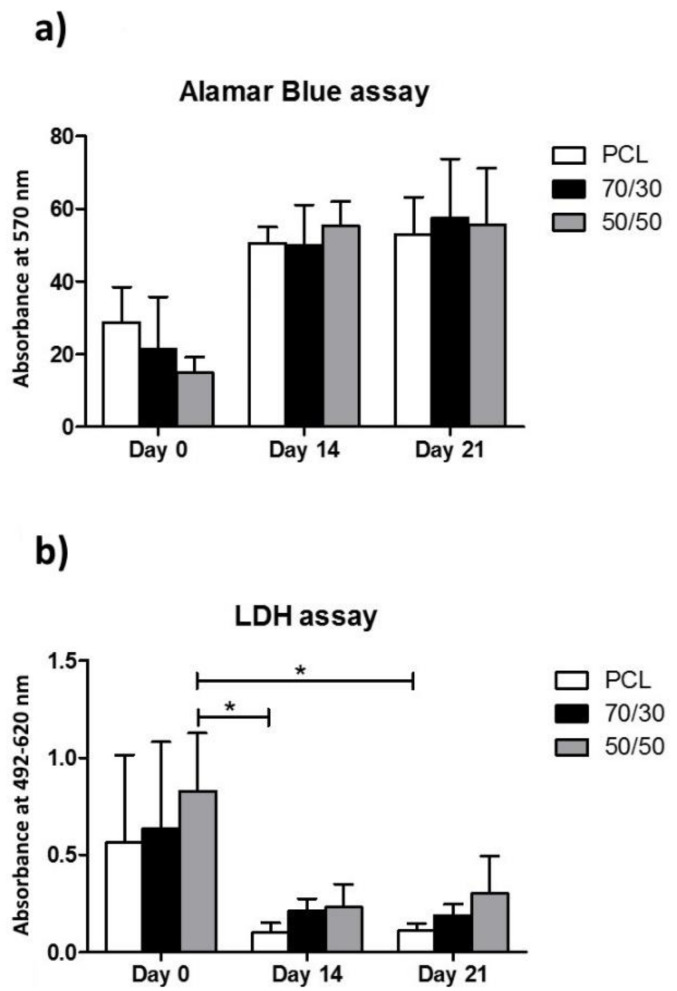
Figure 8.
(a) Alamar Blue® and (b) LDH assay to evaluate the cell vitality and cytotoxicity, respectively, of pure PCL, 70/30, and 50/50 scaffolds at 0, 14. and 21 days. Alamar Blue and LDH graphs were expressed as mean ± SD. Data were compared by the Kruskal–Wallis test, followed by Dunn’s post-hoc test, with * p < 0.05.

