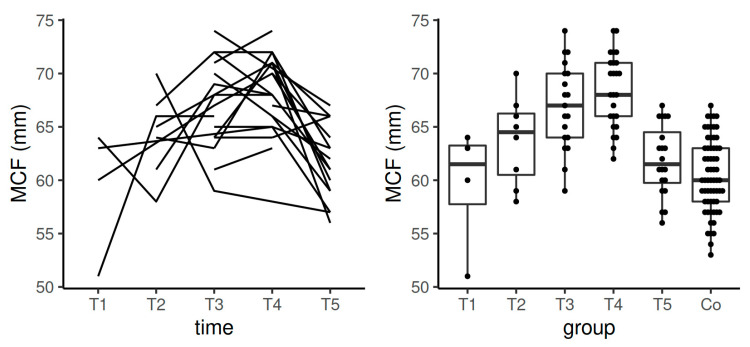
Figure 8.
Spaghetti plot of the data from the longitudinal study (left), and swarmplot with boxplot of the same data together with the data from the control group (right)—the results of MCF in INTEM. Legend: Co—control group, MCF—maximum clot firmness, T1—time interval 1, T2—time interval 2, T3—time interval 3, T4—time interval 4, T5—time interval 5.

