Figure 3.
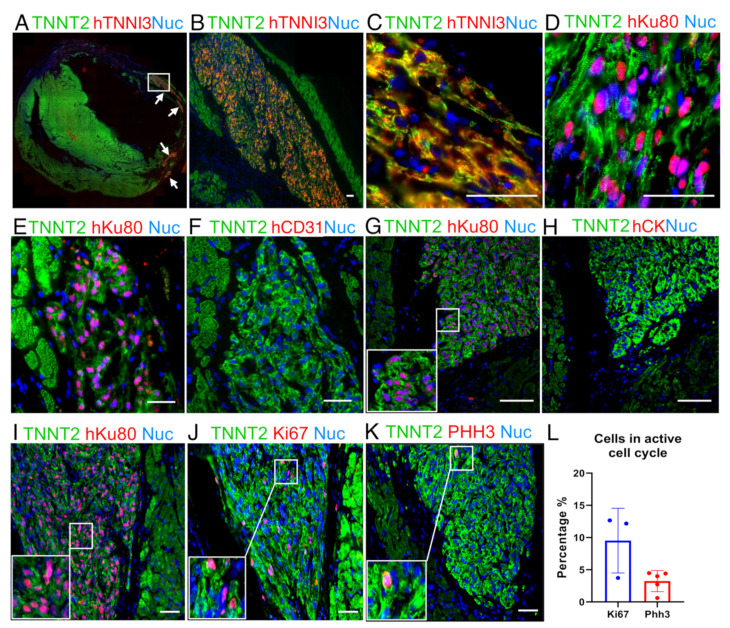
Representative image from a human graft showing cardiac cellular composition. (A) Panoramic immunofluorescence staining for TNNT2 (green, rat and human) and human TNNI3 (red, human-specific): arrows indicate grafts. (B) An amplified view of largest graft region marked by the white rectangle in A. (C) Higher magnification of (B) showing sarcomere structure organization. (D) Image showing that hiPSC-CMs follow cardiac structure organization, TNNT2 (green) and hKu80 (pink) by overlap for hKu80 (red) and nuclei (blue). (E–H) Images showing no evidence of hiPSC-CMs trans-differentiation into cell types other than cardiomyocytes. Serial slices were labeled for hKu80 (E) and human CD31 (F). The same strategy was used to label hKu80 (G) and human Cytokeratin-1 (H). (I–L) Ki67 and PHH3 markers evidenced that the human cardiac grafts were composed of hiPSC-CMs with an active cell cycle. (I) Serial slides were labeled as TNNT2 (green) and hKu80 (pink), (J) TNNT2 (green) and Ki67 (pink), and (K) TNNT2 (green) and PHH3 (pink). Pink represents the overlap of red and blue (nuclei). (L) Quantification for cell-cycle markers presents a percentage of Ki67-positive cells and PHH3-positive cells (vs. the total number of hKu80-positive nuclei for each image analyzed). Ki67: n = 3 and PHH3: n = 5. Scale bars: 50 µm.

