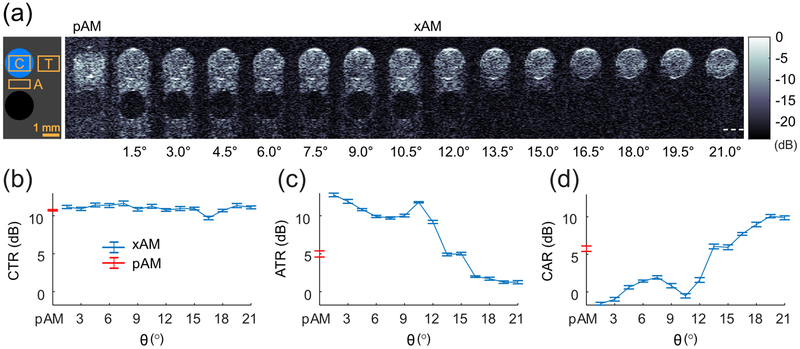
FIG. 5.
In vitro pAM and xAM images of an hGV inclusion in a tissue-mimicking phantom. (a) Left, schematic of the phantom configuration: linearly scattering tissue-mimicking medium in gray, hGV inclusion in blue, anechoic agar-filled inclusion in black, and ROIs for contrast (C), tissue (T) and artifact (A) quantification. Right, set of pAM and xAM images of a representative well positioned at z = 4 mm. Separate images spanning depths of 3 mm to 9 mm are concatenated. Scale bar: 1 mm. White dotted line: ZX at θ = 21°. (b) Contrast-to-tissue ratio (CTR) as a function of θ. (c) Artifact-to-tissue ratio (ATR) as a function of θ. (d) Contrast-to-artifact ratio (CAR) as a function of θ. N = 6. Error bars: SEM.

