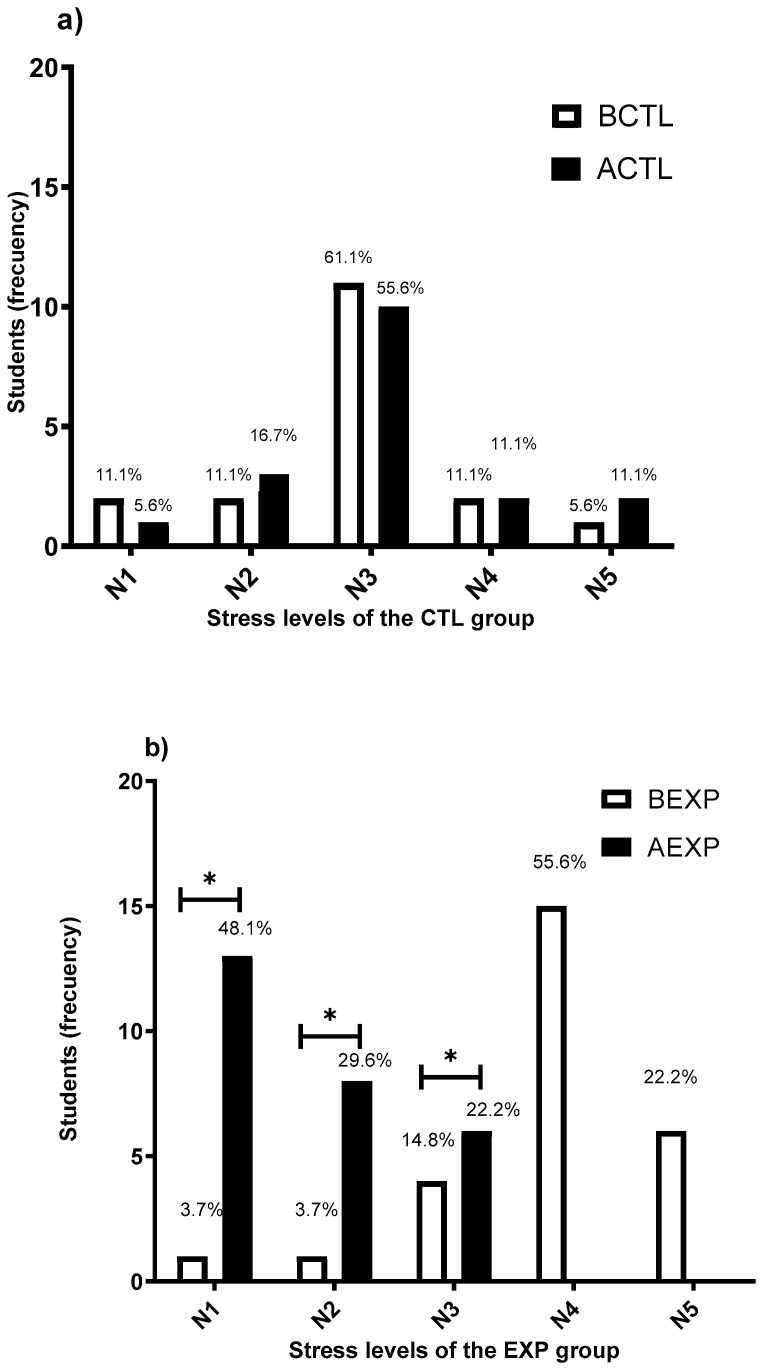
Figure 2.
Academic stress intensity levels. Frequency of students which perceived each stress level: N1, N2 (low stress level), N3, N4, N5 (high stress level). (a) Before (BCTL) and after (ACTL) the intervention with the placebo beverage (CTL group): data did no show significant differences (p = 0.607). (b) Before (BEXP) and after (AEXP) the intervention with the FBLAB (EXP group): data showed significant differences (* p = 0.001, α = 0.05). Statistical analysis was performed using the Student t-test.

