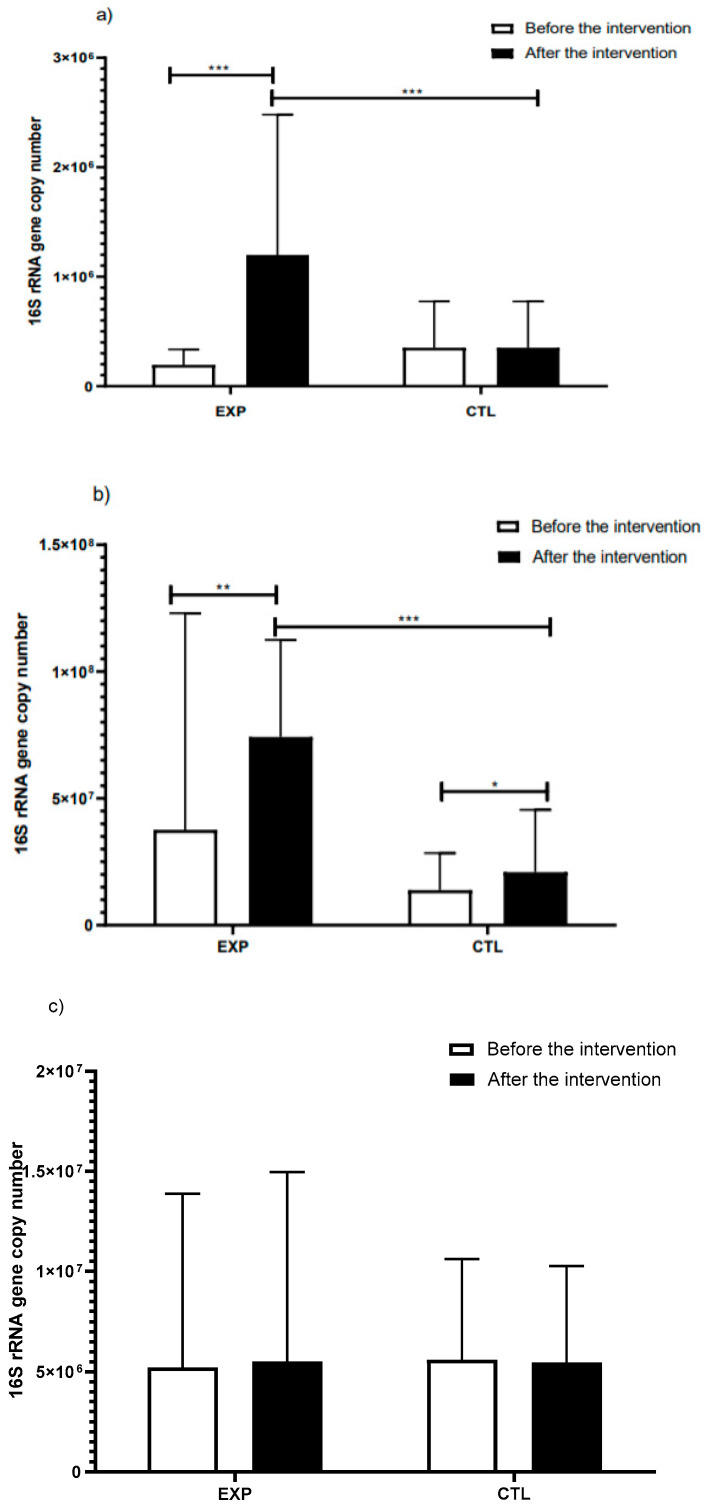
Figure 3.
Abundance of the phyla Bacteroidetes (a), Firmucutes (b) and Gammaproteobacteria (c), in the feces microbiota of students with academic stress before (white) and after (black) the intervention with the FBLAB (EXP group, n = 27) or the placebo beverage (CTL group, n = 18). Abundance is expressed as 16S rRNA gene copy number. Non-parametric Kruskal–Wallis tests were applied to make comparisons between the three phyla; the Wilcoxon signed rank test was used to compare the before and after measurements and the Mann–Whitney test was used to compare the measurements between the intervention groups. Significant difference: * p < 0.05, ** p < 0.01, *** p < 0.001.

