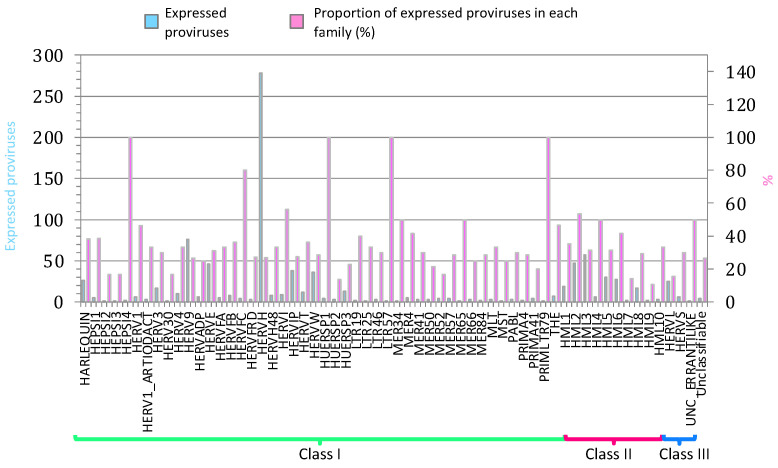
Figure 1.
ReTe HERV transcriptome in PBMCs. Basal expression of the most intact HERV loci as reported in Vargiu et al. All the expressed elements are grouped by retroviral classes and groups. Light blue bars indicate the absolute number of expressed proviruses in each retroviral group, while pink bars indicate the percentage of expressed proviruses among each group’s total members.

