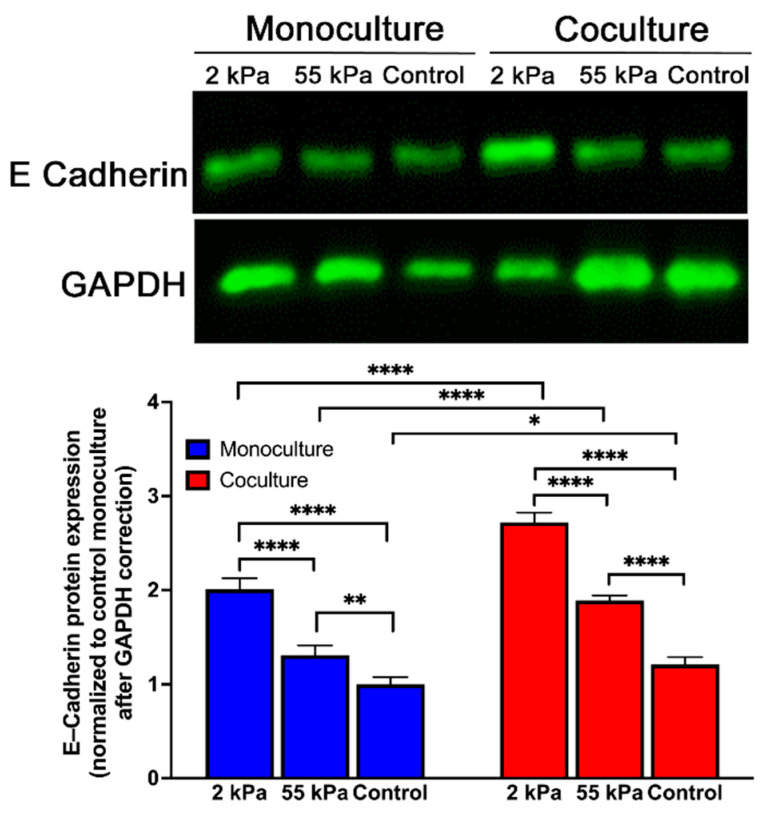
Figure 5.
Expression of E-cadherin in hepatocytes cultured on PDMS gels. Western blot and quantification of e-cadherin expression of primary hepatocytes when cultured on soft, stiff, and TCPS substrates. Error bars indicate standard deviation of the mean for n = 3 samples. * p < 0.05, ** p < 0.01, **** p < 0.0001. The representative blot does not accurately represent the quantitative mean data shown.

