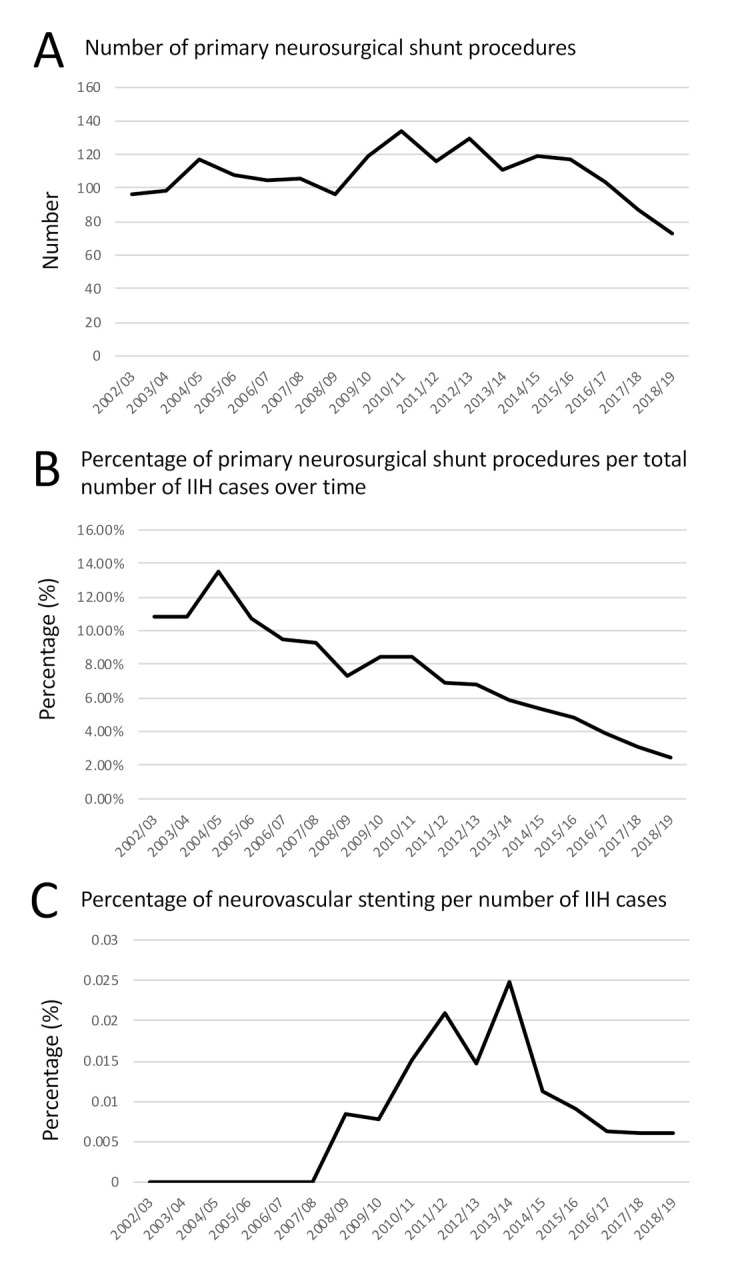
Figure 3.

Primary shunts and stents in IIH. (A) Number of primary neurosurgical shunts performed over time (B) Line graph shows the percentage of primary neurosurgical shunt procedures per total number of IIH cases diagnosed in the same year over time; (C) Line graph shows the percentage of neurovascular stenting procedures per total number of IIH cases diagnosed in the same year over time.
