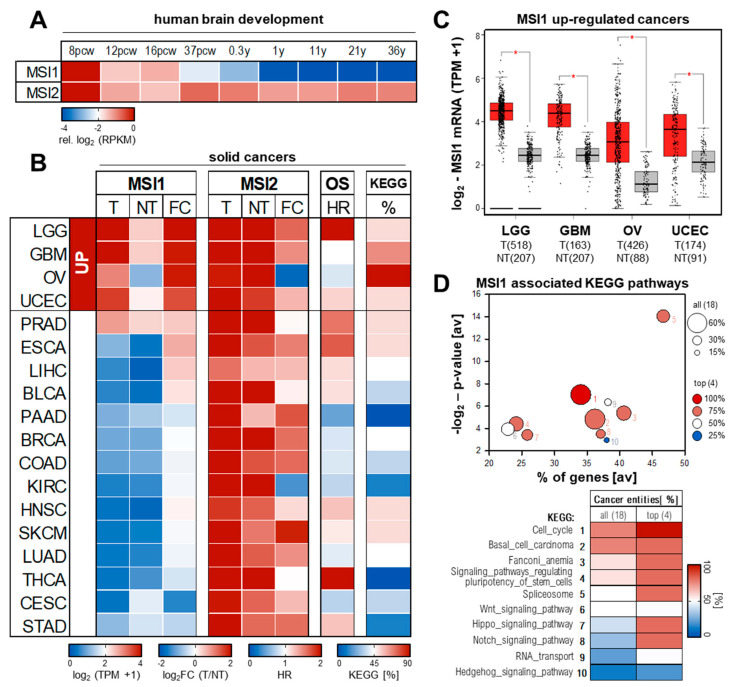
Figure 2.
MSI1 expression and conserved association to hallmark of cancer pathways. (A) MSI1 and MSI2 expression in human brain development. Expression values (from https://www.brainspan.org/, accessed on 30 March 2021) in the neural plate determined by RNA–Seq is shown relative to 8 pcw. Pcw, post conception week; y, years. (B–D) Average (B) and total (C) expression values of MSI1 and MSI2 for tumor (T; TCGA, red) and non–tumor (NT; TCGA and GTEx, gray) tissues as well as fold changes (FC) of tumor vs. non–tumor tissue were obtained from the Gepia2 database (http://gepia2.cancer–pku.cn, accessed on 30 March 2021). Association of MSI1 with overall survival (B; OS) indicated as hazardous ratio (HR) was determined by KM plotter (https://kmplot.com/, accessed on 30 March 2021). The association of MSI1 positively correlated genes with cancer hallmark related KEGG (Kyoto Encyclopedia of Genes and Genomes) pathways was determined using the R2 database (https://hgserver1.amc.nl/, accessed on 30 March 2021). Top 10 of conserved associated pathways are shown as bubble diagram and heatmap (D) with number indicating ranking. The percentage of altered KEGG pathways (top 10) for the respective tumor entities is shown as heatmap (B, KEGG). BLCA, Bladder Urothelial Carcinoma; BRCA, Breast invasive carcinoma; CESC, Cervical squamous cell carcinoma and endocervical adenocarcinoma; COAD, Colon adenocarcinoma; ESCA, Esophageal carcinoma; GBM, Glioblastoma multiforme; HNSC, Head and Neck squamous cell carcinoma; KIRC, Kidney renal clear cell carcinoma; LGG, Brain Lower Grade Glioma; LIHC, Liver hepatocellular carcinoma; LUAD, Lung adenocarcinoma; OV, Ovarian serous cystadenocarcinoma; PAAD, Pancreatic adenocarcinoma; PRAD, Prostate adenocarcinoma; SKCM, Skin Cutaneous Melanoma; STAD, Stomach adenocarcinoma; THCA, Thyroid carcinoma; UCEC, Uterine Corpus Endometrial Carcinoma.

